XAUUSD 4H Analysis | Institutional Structure
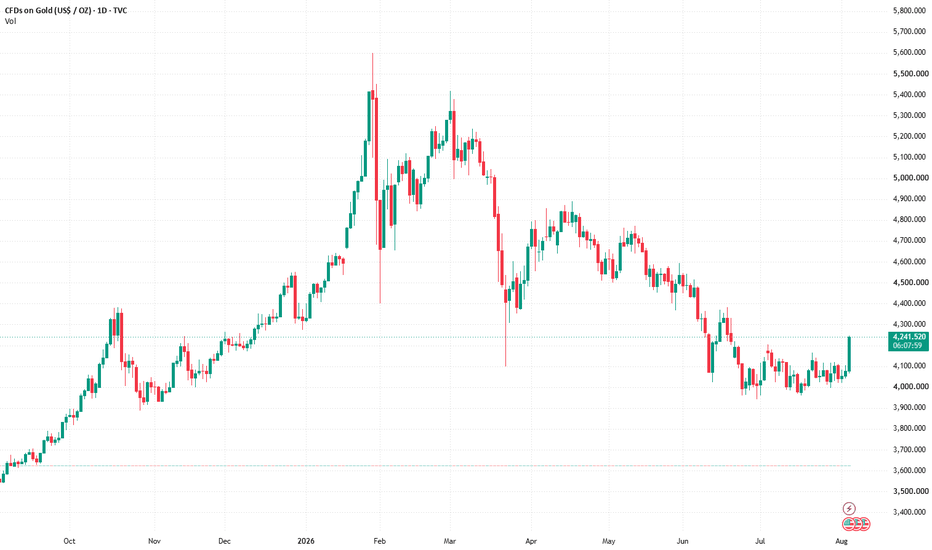
Professional Candle-by-Candle Educational Breakdown
1. Strong Bearish Expansion
The opening part of the chart displayed several decisive downward candles with solid bodies and limited buying response. Price failed to remain at higher levels and moved lower with noticeable force, confirming strong bearish pressure.
Explanation:
The market reacted from an expensive price area, where selling interest became dominant. As supply increased, sellers pushed price sharply toward lower levels.
2. Bearish Structure Break
A series of declining candles moved below earlier swing points and formed fresh lower lows. This confirmed that the previous support structure had failed and that bearish order flow remained active.
Explanation:
Once price traded beneath the earlier lows, the market demonstrated that sellers had enough strength to overcome support and continue controlling the short-term direction.
3. Stop Collection Below Previous Lows
Price briefly extended beneath established lows before forming long rejection wicks and moving back upward. This behavior suggested that liquidity resting below those lows had been taken before the recovery began.
Explanation:
Institutional participants frequently drive price toward visible stop-loss areas. After this liquidity is absorbed, the market may begin moving in the opposite direction.
4. Bullish Response From Demand
Following the liquidity grab, upward candles began forming inside the demand area. Buying activity increased, slowing the decline and producing a temporary recovery.
Explanation:
The demand zone contained enough buying interest to absorb part of the available selling pressure and support a move back toward higher prices.
5. Short-Term Character Shift
Bullish candles later moved through nearby minor resistance and broke above previous lower highs. This created a CHoCH and signaled a temporary change in short-term control.
Explanation:
By overcoming the latest lower high, buyers showed that bearish momentum was weakening and that bullish participation had become more active.
6. Sideways Liquidity Development
After the recovery, candle ranges became narrower and price began moving horizontally. Similar highs and lows developed within the range, indicating that liquidity was accumulating on both sides.
Explanation:
Neither buyers nor sellers had enough strength to create a clear breakout. The market remained balanced while preparing for a stronger expansion.
7. Rejection Near Dynamic Resistance
As price approached the upper boundary and descending trendline, bullish candles became weaker and several upper shadows appeared. This showed that upward movement was being rejected.
Explanation:
Sellers responded around the resistance area and limited further bullish progress, keeping the broader downward pressure relevant.
8. Equal High Liquidity Formation
Price tested the same upper level several times without producing a confirmed breakout. These repeated peaks formed equal highs and created a visible pool of buy-side liquidity above them.
Explanation:
Stops and pending orders commonly accumulate above equal highs. This makes the area a potential future liquidity objective.
9. Current Price Indecision
The most recent candles are trading within the important 4003–4069 region. Their smaller bodies and reduced momentum show that both sides are currently struggling to establish control.
Explanation:
Price is testing the balance between nearby support and resistance. The next confirmed move may determine whether buyers or sellers gain the advantage.
10. Buyer Activity Inside the Demand Area
The highlighted blue region marks an area where price previously produced a strong bullish reaction. A new rejection from this zone could support another upward correction.
Explanation:
Demand areas may contain unfilled buying interest and liquidity capable of slowing or reversing bearish movement.
11. Possible Downside Continuation
If the demand zone fails to support price, decisive bearish candles may close below the area and continue toward the weak low beneath the current structure.
Explanation:
A confirmed support break could activate additional selling pressure and attract price toward the next pool of sell-side liquidity.
12. Educational Summary
The current XAUUSD 4H structure reflects ongoing competition between descending trendline resistance and demand support. A professional approach requires confirmation rather than an early directional assumption.
Important signals include:
BOS confirmation
CHoCH development
Liquidity collection
Trendline rejection or breakout
Supply and demand reactions
Core Principle:
Every candle records the interaction between buying and selling pressure. Studying why a candle forms, where it appears and which liquidity it targets can provide a clearer view of institutional market behavior.