WEN | Wendy's | Q3 Earnings 2026 | Day Chart
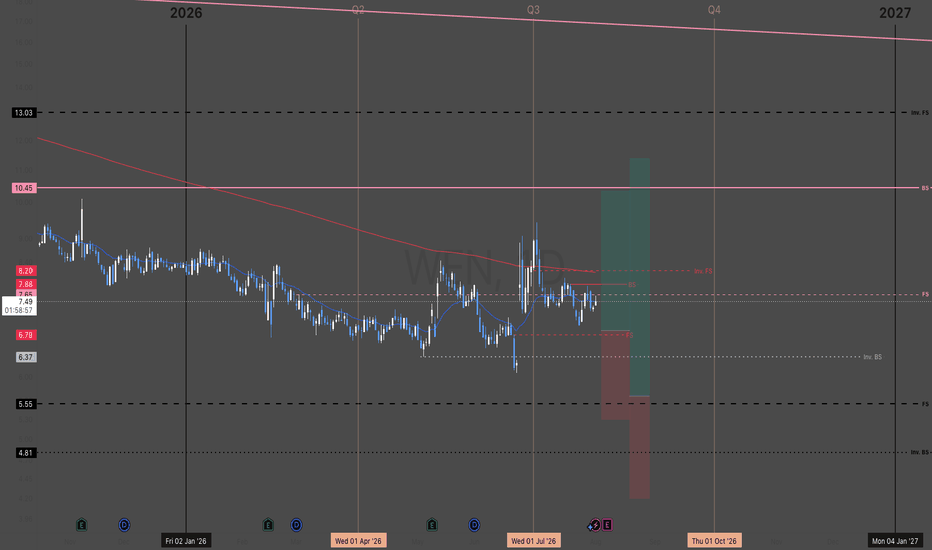
Wendy's Company (The)||
MARKET-BEATING SCORE = 3/10
Dividend yield (indicated)
7.61%
"engages in operating, developing, and franchising a system of quick-service restaurants "
-----------------------------------
PEGY 0.77 — fairly valued.
EPS growth 5.0% — modest.
Revenue growing 3.0% YoY — steady.
Gross margin 35.0% — decent.
FCF margin 6.0% — real cash generation.
D/E 35.62 — high leverage.
-----------------------------------
"Could a policy change or major competitor disrupt growth in the next 2 years?"
Wendy's faces moderate risk from intense competition and evolving labor regulations, particularly in key markets like California where new laws (AB 1228) impact wage and employment standards. While the company is pursuing growth through digital acceleration and international expansion, it is significantly outsized by rivals like McDonald's and Yum! Brands, leaving little margin for error in its strategic execution. Additionally, supply chain vulnerabilities and high leverage, reflected in a negative outlook from S&P Global, could further disrupt growth if macroeconomic conditions remain strained.
Risk Level:
Moderate
----------------------------------
POSITIVE CATALYST OUTLOOK
"Could a policy change or competitor headwinds create a positive catalyst in the next 2 years?"
A potentially less restrictive regulatory environment under the second Trump administration could reduce compliance burdens and foster innovation within the quick-service industry, providing a macro tailwind for Wendy's. While the company currently faces traffic struggles, its strategic focus on digital acceleration and value-oriented marketing may allow it to capture market share if larger rivals face pricing fatigue or increased regulatory scrutiny.
Additionally, high short interest has recently triggered retail-driven momentum and 'short-squeeze' speculation, which could serve as a significant, albeit volatile, catalyst for the stock price in the near term
Positive Outlook:
Moderate
-----------------------------------
Multiple Time-Frame Analysis; Color Code | Strength favors the higher timeframe.
Yearly timeframe = black
Monthly timeframe = pink
weekly = grey
daily = red
4hr = orange
1hr = yellow
15min = blue
5min = green if they are shown. (Level visibility on intervals is set to timeframe the level was found on and below to keep chart view organized.)
** Candle Science explained **
A Range = two or more consecutive color candles.
There are two types of ranges - accumulation and distribution. **A single candle is a range on a lower timeframe. *Find the range and define its, creation dates, prices, and risk parameters. A range is broken down into 4 candle, which create 6 levels that define the range and illustrate market structure.
Focus only on the first and last candle of each range. The last candle of each type of range has two levels - see FS & Inv. FS Candles below.
DISTRIBUTION RANGES DEFINED:
When price is above a distribution range, these candles/levels act as support.
(BS) BACKSIDE Candle - First distribution candle in a distribution range. Expectation = strong reaction to price. long wicks reaching to or away from level. high angle accumulation trends, f.v,g's
(FS) FrontSide Candle - Last distribution candle in a distribution range. Expectation = reversal, create a low angle accumulation trend. The top of Distribution candles are used as support. The bottom of the FrontSide candle is the SwingLow of the range. The FS candle wants to protect the SwingLow. When/if Price Action closes below the SwingLow, the level is invalidated. Find another range to trade.
ACCUMULATION RANGES DEFINED: When price is below an accumulation range, these candles/levels act as resistance.
INVERSE BACKSIDE (Inv.BS) - First Accumulation candle in an accumulation range. Expectation. = strong reaction to price. long wicks reaching to or away from level. Creates high angle distribution trends, f.v.g, protects the Inv.FS candle
INVERSE FRONTSIDE (Inv.FS) - Last accumulation candle in an accumulation range. Expectation = reversal, create a low angle distribution trend. The bottom of Accumulation candles are used as resistance.
The top of the Inv.FrontSide candle is the SwingHigh of the range. The Inv.FS candle wants to protect the SwingHigh. When/if Price Action closes above the SwingHigh, the level is invalidated. Find another range to trade.