US100 - Statistical approach
M.I. Quant Market Intelligence
US100 Statistical Outlook
The following observations are derived from the M.I. Quant Probability Engine, which analyzes thousands of historical market-state transitions and probability distributions rather than discretionary chart interpretation.
1. Bullish Continuation Scenario
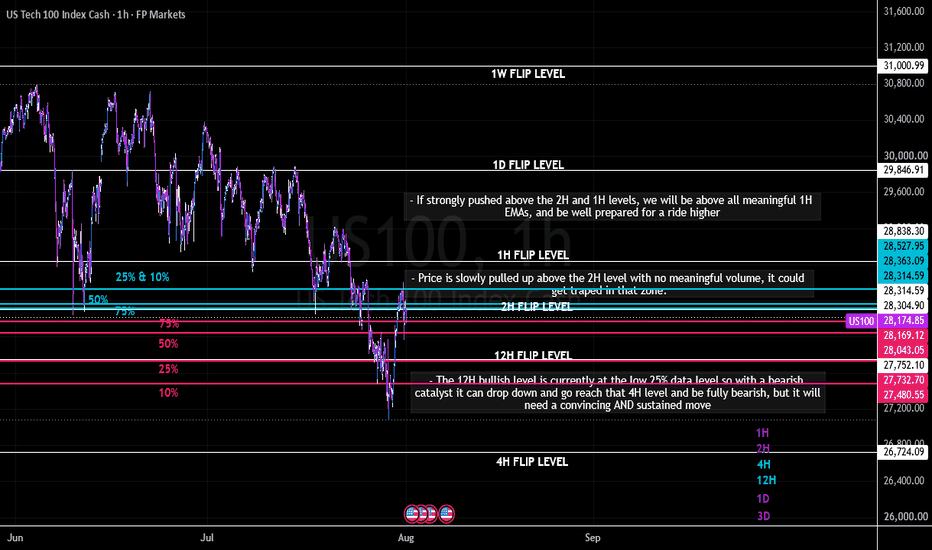
A sustained move above the 1H and 2H MACD Flip Levels would place price above every major short-term trend reference on the hourly structure.
Historically, this alignment represents a significant improvement in bullish market structure and increases the probability of continuation into higher statistical objective zones.
Market implication: A decisive break above both levels would strengthen the probability of an extended bullish phase rather than a temporary intraday rally.
2. Current Market Structure
Price is currently drifting below the 2H Flip Level, but the advance has developed with relatively limited participation.
Without meaningful buying pressure, this area remains susceptible to rejection, increasing the probability of a failed breakout and a return toward lower probability levels.
Market implication: Confirmation through sustained participation is preferred before assigning higher confidence to the bullish scenario.
3. Downside Statistical Scenario
The 12H Bullish Flip Level currently coincides with the historical 25% probability zone generated by the M.I. Quant research database.
Should a meaningful bearish catalyst emerge, this area represents the first statistically significant downside objective.
A successful move through the 12H level would progressively shift higher-timeframe momentum toward bearish alignment, opening the path toward the 4H Flip Level, where historical probability suggests the broader market structure would transition into a fully bearish regime.
Market implication: This scenario requires a sustained deterioration in momentum rather than a brief intraday pullback.
Research Basis
This analysis is produced using the M.I. Quant Market Intelligence Engine, which combines:
Multi-timeframe MACD regime analysis
Historical probability distributions
ATR-normalized statistical targets
Historical state-transition modeling
Multi-timeframe MACD Flip Levels
Volume according to price action
The scenarios above are derived from historical market behavior observed across thousands of previous market-state transitions and should be interpreted as probability-based reference zones, not deterministic