
The Stochastic Oscillator: Why Overbought Rarely Means Sell
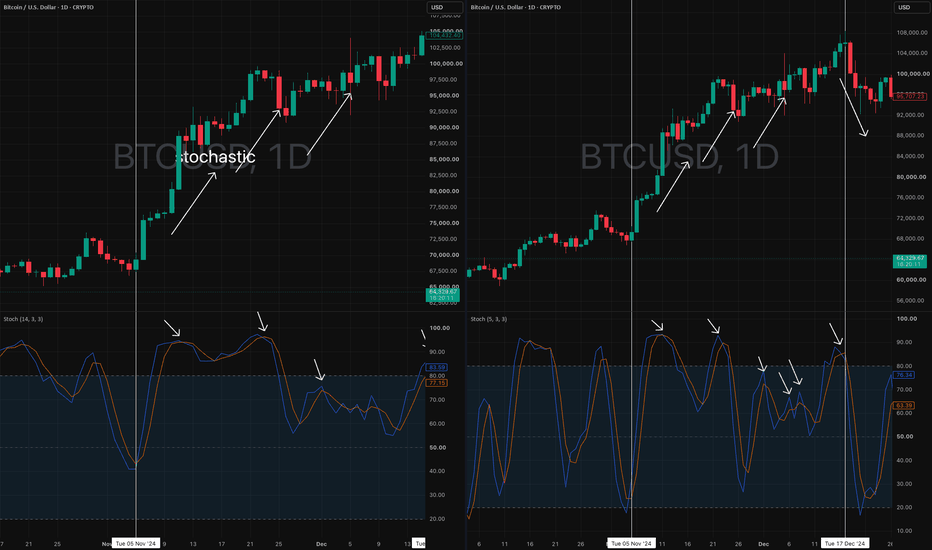
A reading above 80 is the most misread number in technical analysis. Traders watch the stochastic climb into the overbought band, read it as an instruction to sell, then watch price rise for another three weeks. The indicator was not wrong. It answered a different question from the one they asked.
The stochastic measures location, not force. It says where the close sits inside the recent range and nothing about the power behind the move. A market closing near the top of its range daily is not exhausted, it is trending.
What Is the Stochastic Oscillator?
The stochastic oscillator plots where the current close sits within the high-to-low range of the last n periods, scaled from 0 to 100. If Bitcoin traded between 90,000 and 100,000 over the past 14 days and closed at 98,000, the reading is 80.
%K equals the close minus the lowest low, divided by the highest high minus the lowest low, times 100. Nothing in it measures the size of the moves or the speed of the advance. It measures placement.
The tool came from Chicago futures traders at Investment Educators in the 1950s, and George Lane spent his career teaching it. He set out the standard reading in Lane's Stochastics, published in Technical Analysis of Stocks and Commodities in 1984: as a market falls, closes crowd the bottom of each daily range, and shortly before the low is in they stop doing so.

%K and %D: The Two Lines
The stochastic indicator on TradingView plots two lines. %K is the raw calculation above and moves with every close. %D is a three-period moving average of %K, the signal line, and lags by design. When %K crosses above %D, closes are landing higher in the range than they had been, and that shift happens whether or not the reading is near 20 or 80.
Stochastic Against RSI: Two Different Questions
Both sit in a 0 to 100 panel with overbought and oversold bands, which is why traders treat them as interchangeable. RSI, from Wilder's 1978 book New Concepts in Technical Trading Systems, compares the average size of up closes to the average size of down closes: a ratio of force.
Relative Strength Index
- Measures: average gain against average loss
- Reacts to: the size of each move
- Default bands: 70 and 30
- In a strong trend: can hold above 70 for weeks
- Measures: position of the close inside the recent range
- Reacts to: the location of the close, not the size of the move
- Default bands: 80 and 20
- In a strong trend: pins near 100 and stays there
Advice on how to use stochastic oscillator readings splits into two camps, and the split is an argument about market regime.
The zone method says buy below 20 and sell above 80. It works in a range, where the indicator's extremes line up with real boundaries, and fails in a trend for the mechanical reason above: the close lands near the top of the range most days, so the reading stays above 80 for as long as the trend runs.
The evidence goes further than "oscillators fail in trends." A 2015 study in Emerging Markets Finance and Trade tested what follows overbought signals from stochastic oscillator indicators on Shanghai Stock Exchange 50 constituents and found momentum strategies, trading with the move, were the correct response. A later study by the same group in Financial Innovation found the reverse on Korea's KOSPI 50, where contrarian strategies won in every case tested.
The crossover method travels better. You trade the %K and %D cross rather than the level, which marks a change in where closes are landing whether the reading is 15, 50 or 90. Take crossovers only in the direction of the higher timeframe trend, and treat a cross inside the 20 or 80 band as a stronger signal.
What This Looked Like on Bitcoin
Between the US election on 5 November 2024 and 5 December 2024, Bitcoin rose from roughly 69,000 dollars to its first print above 100,000, reaching a record above 109,000 on 20 January 2025. Closes landed in the upper part of the two-week range throughout, so the daily stochastic held above 80 for most of the run.
Stochastic Divergence: Catching Reversals Early
Divergence is where price and the indicator disagree. Bullish stochastic divergence is a lower low in price against a higher low in the oscillator: each low closes less deeply inside its range than the last. Bearish stochastic divergence is the mirror image, a higher high in price against a lower high in the oscillator.
Lane called it the only valid signal there is: the divergence between %D and the instrument traded.
A study by market technician Cynthia Kase across 43 commodity futures and six currency pairs, roughly 157,000 daily bars, put numbers to that. When a stochastic divergence appeared, a turn followed about 85 percent of the time against a base rate near 9 percent. Kase counted a turn as a move of two bars' true range against the trend, a meaningful pullback rather than a confirmed reversal.
The same study carries the case against. Divergence preceded only 18 percent of the turns that happened; the rest came with no warning. It is precise and rare, so use it to tighten a stop or take partial profit, not as a reversal-detection system.
Settings: 14, 3, 3 and the Fast Stochastic
The default is 14, 3, 3: a 14-period lookback, three-period smoothing on %K, a three-period average for %D. That is the slow stochastic, and the double smoothing is what makes it readable on daily charts.
The Fast Stochastic at 5, 3, 3 shortens the lookback to five periods. It reacts sooner and fires far more signals, most of them false, so it belongs on intraday charts where a wrong read is cheap to exit.
Kase's data argues for the short setting on other grounds. Varying the lookback from 5 to 55 periods, the share of real turns preceded by a divergence rose from 18 percent at the default to 24 percent at five, with no offsetting jump in false signals.
Stochastic RSI Is Not the Stochastic Oscillator
Stochastic RSI is a separate indicator. Chande and Kroll introduced it in their 1994 book The New Technical Trader by applying the stochastic formula to RSI values instead of price, so it asks where the current RSI sits inside its own range.
It is far more sensitive than either parent and spends much of its life pinned at 0 or 100. That makes it a tool for timing an entry inside a direction you have already chosen, not for choosing the direction.
When It Works and When It Fails
It works when price rotates inside a defined range, when you act on the crossover rather than the level, and when divergence manages a position you already hold. It fails when a trend is running, when the level by itself is the whole trade, and when it is the only input on the chart. The Chinese and Korean studies reached that conclusion from opposite directions: the right response to an overbought signal depends on the market's behavior, which the oscillator cannot tell you.
So run the regime test first, without the oscillator. Above a rising longer moving average, with higher highs, the 80 line is not a sell. Around a flat average, the zones are meaningful again. The stochastic reports one thing accurately: where the close sits in the recent range. In a range that marks a boundary; in a trend it marks strength.
