The market doesn't lie; only emotions can!
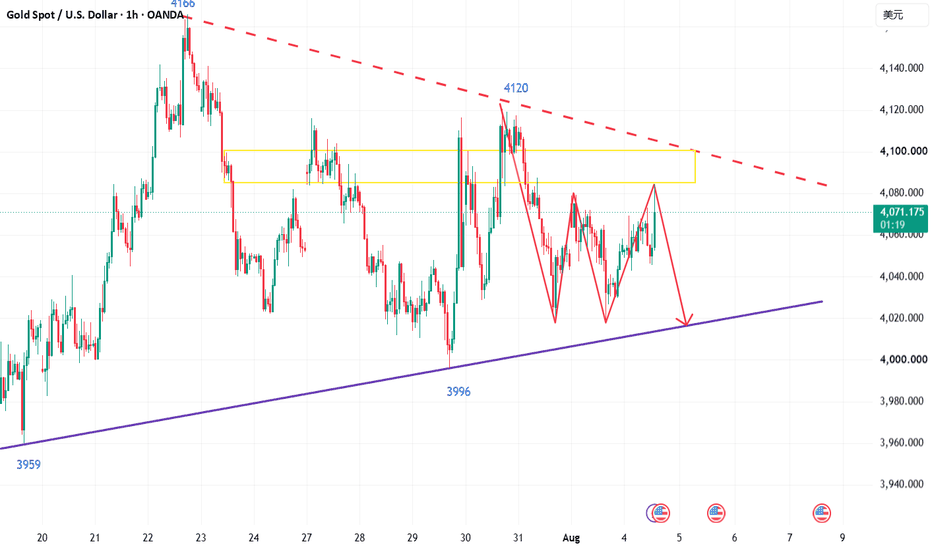
Gold Technical Analysis: Gold rebounded after hitting a low yesterday, and the overall trend still conforms to the pattern of a range-bound market. The current market shows a converging structure with gradually lower highs and continuously higher lows, which is a typical consolidation pattern. Although the Asian and European sessions yesterday saw a downward trend, there was no overall breakout. Therefore, the pullback to around 4020 in the US session without breaking the previous low remains a key position for placing long orders. This is a classic application of the theory of strength and weakness reversal to find high-probability entry points. From a daily chart perspective, gold continues its downward trend, with the overall bearish structure unchanged. Prices continue to fluctuate, indicating the market is still in a directional decision-making phase. From a 4-hour chart perspective, the Bollinger Bands continue to narrow and gradually flatten, with gold prices fluctuating around the middle Bollinger Band. Short-term moving averages have gradually shifted from a bullish alignment to convergence, and the KDJ indicator has turned downwards, indicating a further need for a short-term pullback to confirm support. This suggests that bullish momentum has weakened compared to the previous period. On the 1-hour chart, the price continues its downward trend with fluctuations, trading below the short-term moving averages. Overall, the chart shows a multi-timeframe divergence pattern: daily chart fluctuations, weakening bullish momentum on the 4-hour chart, and a slightly weak hourly chart. In the short term, the price is mainly consolidating within a range. Currently, the 1-hour chart continues to trade within the 4000-4100 converging triangle range. Until there is a valid breakout from this range, the market will continue to fluctuate. This week, the market will also see important events such as ADP employment data, initial jobless claims, and non-farm payroll data. These fundamental factors are expected to be important catalysts for breaking the current convergence range and driving the market to choose a direction. In summary, the recommended trading strategy for gold remains "primarily selling on rallies, secondarily buying on dips." Key resistance levels to watch are the 4085-4100 area, and key support levels are the 4020-4000 area. Until the range is decisively broken, sticking to trend trading and patiently waiting for key levels is far more likely to yield high-probability opportunities than blindly chasing highs and lows.