NVDA 1H: Crucial Retest at Premium Supply Zone
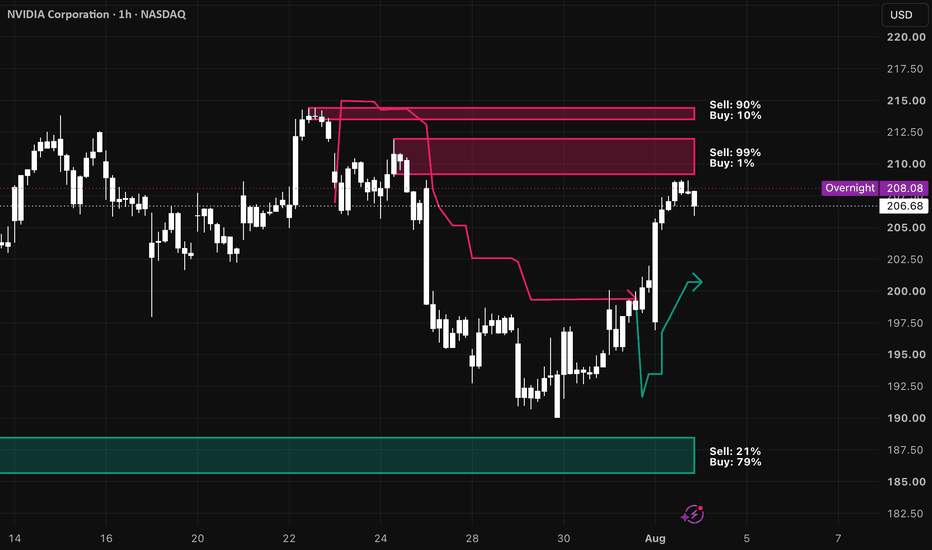
After a period of consolidation and a deep pullback to the high $180s, NVIDIA (NVDA) has staged a powerful V-shaped recovery. Price action has now returned to a major overhead supply zone. The 1H chart shows we are in a 'premium' pricing area, where substantial institutional selling has previously occurred. This presents a high-probability decision point.
Technical Breakdown
1. Primary Support/Accumulation Zone (Bottom - Green Box):
Location: ~$185.00 – $189.00
Chart Note: This area was identified as "Buy: 79% / Sell: 21%", indicating a powerful demand imbalance. The market successfully tested this zone and held it, sparking the current rally. This is now our critical 'must-hold' macro support.
2. Immediate Price Action & The Recovery:
Following the test of the green accumulation zone, the price rocketed upwards, re-claiming previous structural levels (indicated by the teal recovery arrow).
3. Major Premium Supply Zones (Top - Red Boxes):
We are now entering the critical 'premium' territory where massive overhead resistance exists.
Zone 1: ~$209.00 – $212.50 (Chart Note: "Sell: 99% / Buy: 1%"). This is an incredibly dense cluster of previous sell orders and historical resistance.
Zone 2: ~$213.50 – $215.00 (Chart Note: "Sell: 90% / Buy: 10%"). The absolute 'peak' of the previous range and a final line of defense for sellers.
Trading Plan & Scenarios
🔴 Scenario A: Bearish Rejection from Supply (The Correction Trade)
Concept: Price fails to break the dense "Sell: 99%" zone (~$210.00). Look for bearish confirmation signals (wicking candles, lower high on 5-15 min charts, bearish engulfing).
Entry: Rejection signal inside the $210.00 supply.
Profit Target 1: Minor structural pivot at ~$198.00.
Stop Loss: A 1H close above $213.00.
🟢 Scenario B: Bullish Breakout (Trend Continuation)
Concept: Strong 1H candles close above both red boxes, absorbing all the historical supply. This signals that bulls are in control and ready to target all-time highs.
Entry: Retest and hold of the broken supply zone (~$212.50) as new support, or a convincing breakout candle on high volume.
Profit Target 1: Re-test of recent highs at $215.00.
Profit Target 2: New high discovery ($220+).
Stop Loss: A 1H close back below $208.00 (inside the range).
Conclusion
We are at a key 'inflection point'. Do not chase the current rally into the heart of a major historical supply zone. We are waiting for either a clean rejection signal for a short position or a confirmed breakout (close and hold above the red zones) for a long position. Patience is key at this juncture.