
NIFTY 24550 CE vs PE: Analyzing Premium Expansion & Decay
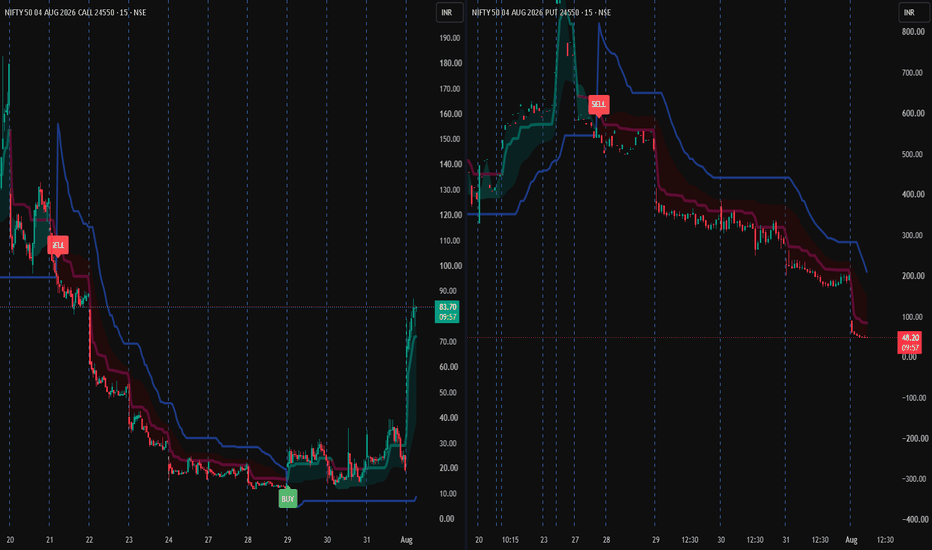
NIFTY 24550 CE vs PE: Analyzing Premium Expansion & Decay Dynamics (15m)
Overview & Analysis Structure
This idea illustrates the inverse relationship and premium movement between the Nifty 04 AUG 2026 24550 CE (left pane) and Nifty 04 AUG 2026 24550 PE (right pane) using dynamic trend bands and trend-following indicators on a 15-minute timeframe.
Technical Breakdown
24550 CE (Left Pane - Bullish Momentum Shift):
Previous Phase: Suffered a steep markdown from levels near 150+ down into base consolidation in the 15–20 zone.
Accumulation & Breakout: Following a sustained consolidation phase around July 29–30, a clear BUY signal triggered a major multi-session expansion, driving the call option premium past 80.
Current Dynamic: The price has broken above the volatility cloud with strong volume expansion (+245%), indicating solid buyer dominance in the underlying index.
24550 PE (Right Pane - Bearish Premium Decay):
Distribution & Breakdown: Experienced a strong rejection and a subsequent SELL signal near the 600+ peak around July 28.
Downtrend Continuation: The put option has consistently traded below its dynamic resistance cloud, undergoing severe time decay and price erosion down to the 48–50 zone.
Key Takeaways for Traders
Options Asymmetry: Highlighting how holding long option positions without trend confirmation leads to severe drawdown during distribution phases.
Indicator Confluence: Using volatility clouds on both CE and PE charts helps visualize when one side enters an active expansion phase while the counter-option undergoes sharp decay.
Disclaimer
This post is shared strictly for educational and analytical purposes to illustrate options chart behavior. It does not constitute financial or trading advice. Options trading involves high risk; always enforce strict position sizing and stop-loss protocols.
