NFLX Daily: Mapping Structure Before Looking for the Trade
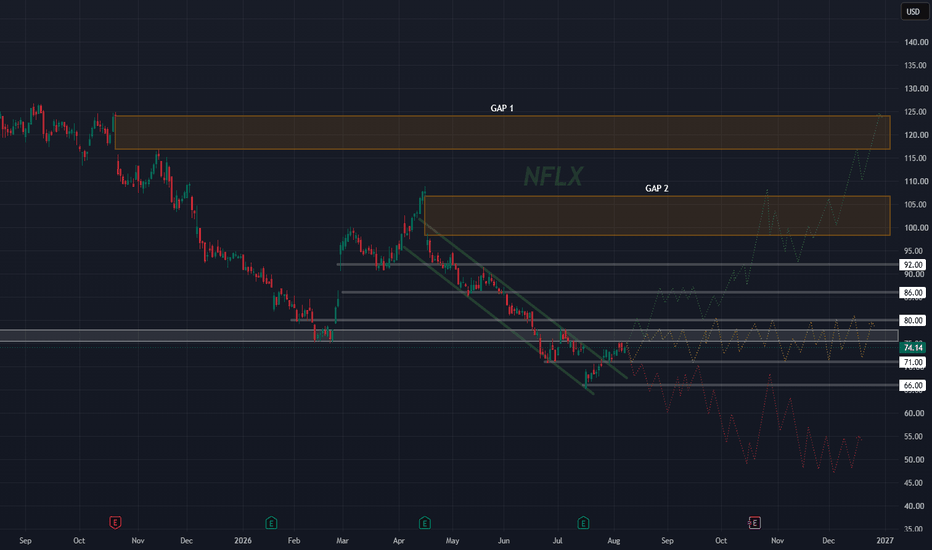
I’m using the daily chart here for forecasting and structure, not as a direct trade setup.
NFLX has spent months in a broader decline, but the most recent price action is beginning to change character. Price has pushed out of the descending channel and is now trying to build above the recent lows.
That’s constructive, but it isn’t enough by itself for me to call this a larger reversal.
There is still a lot of work overhead.
The first levels I’m watching are approximately $80, $86 and $92. Those are the immediate structural checkpoints between current price and the larger upside areas marked on the chart.
If NFLX can reclaim those levels and begin holding above them, Gap 2 around roughly $99–$106 becomes much more relevant.
Beyond that sits Gap 1 around roughly $117–$124. I’m marking it because it belongs on the larger roadmap, not because I expect price to travel there immediately.
Three scenarios
The green path represents the constructive scenario.
NFLX continues building from the recent lows, works through $80, $86 and $92, and eventually begins testing the first major gap area. If that structure continues improving, the higher gap becomes another possible destination later.
But that is only one scenario.
The yellow path is considerably less exciting and completely reasonable: NFLX could simply spend a long time rotating between approximately $71 and $80, building a larger base without producing much directional progress.
Then there is the bearish scenario.
If the recent recovery fails, $71 becomes an important downside reference. Below there, $66 is the next major level on my chart. A loss of that structure would materially weaken the constructive interpretation and reopen the possibility of substantially lower prices.
The gaps are not predictions
I’m especially careful with the two gaps.
I don’t treat an open gap as a promise that price will eventually fill it.
Right now, $80, $86 and $92 matter considerably more to me than either gap. Price needs to prove that it can work through the structure immediately overhead before those larger areas become particularly useful.
Daily structure first. Trades second.
This is really where my top-down process begins.
The daily chart answers:
What are the reasonable larger scenarios, and where are the important decision areas?
It does not necessarily tell me where I want to enter an options trade.
Next I’ll start working down through the shorter timeframes. That’s where I’ll be looking for the actual trading opportunities inside this larger roadmap—entries, confirmations, invalidations and places where the risk/reward begins making sense.
For now, I’m not trying to decide which colored path NFLX will follow.
I’m preparing for all three.