NEAR 8H – Channel Bounce Into Horizontal Resistance
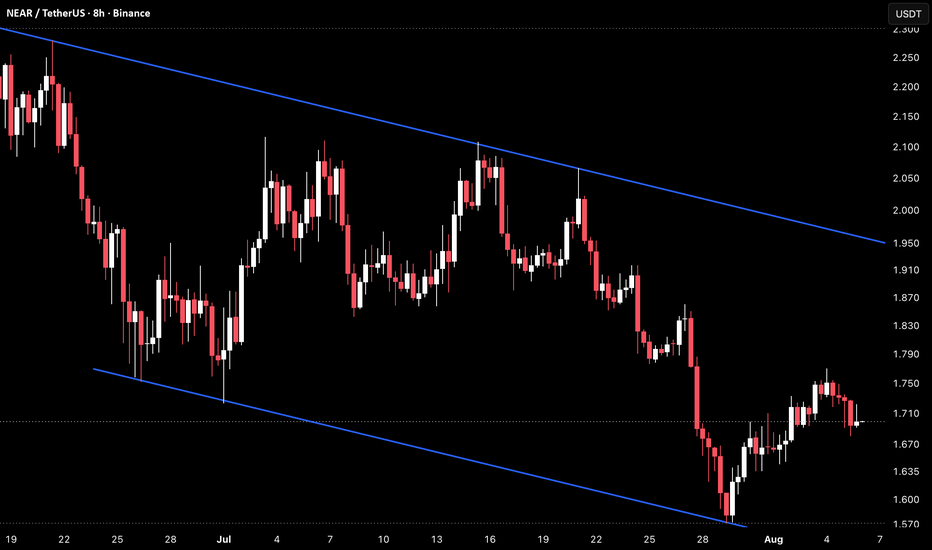
NEAR on the 8H timeframe is currently trading around 2.217 after bouncing from the lower channel boundary near 1.570–1.580 on July 28 and recovering toward the 1.700–1.750 horizontal resistance zone, with the descending upper trendline continuing to compress the structure from above now sitting near 1.950–2.000.
The chart shows a descending channel from the late June high near 2.300, with the upper
trendline connecting that high through the July 7 recovery high near 2.100 and the July 15 high near 2.100, while the lower trendline caught the June 25 low near 1.760, the July 1 low near 1.720, and the July 28 low near 1.570–1.580 before the current bounce. Price oscillated through the mid-to-upper portion of the channel from early to mid-July before the upper trendline rejected the July 15 push near 2.100 and a sharp selloff followed, cutting through the 1.700–1.750 horizontal and the 1.620–1.640 zone before reaching the lower boundary. The recovery from the July 28 low has been sharp, pushing back through 1.620–1.640 and now pressing into the 1.700–1.750 horizontal zone that previously acted as support and now sits as the first meaningful resistance above the bounce low.
Price has recovered more than half of the decline from the July 15 high but is now pressing directly into the broken horizontal zone near 1.700–1.750 with the descending upper trendline sitting overhead near 1.950–2.000, leaving two layers of resistance stacked above.
Key Levels To Watch
→ 2.250–2.300 June high, major resistance above
→ 1.950–2.000 Descending upper trendline, overhead resistance (dynamic)
→ 1.870–1.910 Prior recovery high, resistance
→ 1.700–1.750 Broken horizontal support, current resistance test
→ 1.620–1.640 Secondary support, prior breakdown zone
→ 1.570–1.580 Lower channel boundary, recent bounce low
→ Below 1.520 Channel breakdown, extended downside
A confirmed 8H close above 1.700–1.750 and follow-through toward the descending upper trendline near 1.950–2.000 would keep the channel structure intact and open a potential test of that level before the next directional decision.
A rejection at 1.700–1.750 and a return toward the lower channel boundary near 1.570–1.580 would mark a second test of that level, and a confirmed close below it would signal a full channel breakdown with no clear support visible beneath.
Bounce off lower boundary now testing broken horizontal resistance. Reclaim 1.700–1.750 → upper trendline near 1.950–2.000 next. Reject here → second lower boundary test near 1.570–1.580, break below opens channel breakdown. Bias neutral inside channel. Shift bullish only on confirmed break above descending upper trendline.