MAs (Moving Averages)
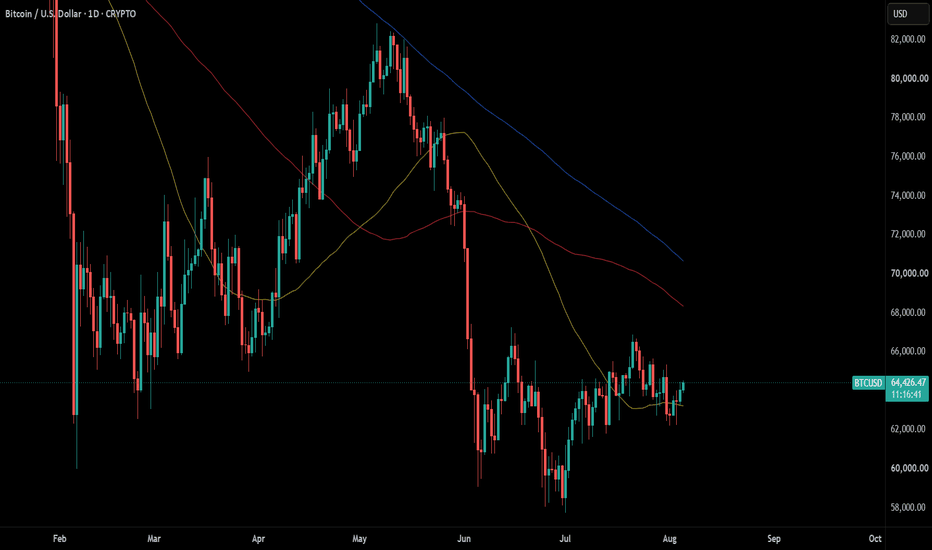
Since we’ve been talking about Fibonacci tools, it’s a perfect time to bring up MAs (Moving Averages), because they are the single most common "confluence" partner used alongside Fibonacci retracements.
a Fibonacci level that lines up perfectly with a key Moving Average is exactly the kind of "high-probability zone" that professional traders look for.
Here is a breakdown of what Moving Averages are, how they work, and how they pair with Fibonacci.
What is a Moving Average (MA)?
A Moving Average is a lagging indicator that smooths out price data by calculating the average closing price of an asset over a specific number of periods (e.g., 10 days, 50 days, or 200 days). As new price data comes in, the oldest data drops out, and the average "moves" forward along the chart.
There are two main types of MAs:
Simple Moving Average (SMA): A straightforward arithmetic average of the prices over a set period. It gives equal weight to every price point.
Exponential Moving Average (EMA): A more complex average that gives more weight to recent prices, making it react much faster to new information than the SMA.
The "Big Three" Timeframes Traders Watch
While traders can use any period they like, three MAs have become industry standards because they are watched heavily by institutions, banks, and algorithmic trading systems:
The 20 EMA / 21 EMA: This is the go-to for short-term traders. It closely tracks the price and acts as a "dynamic support/resistance" for strong, fast-moving trends.
The 50 SMA / 50 EMA: This represents the medium-term trend. Breaking above or below the 50-MA is often seen as a sign that a stock or asset is gaining or losing intermediate strength.
The 200 SMA / 200 EMA: This is the "gold standard" of long-term trend analysis. It is widely considered the line in the sand between a bull and bear market. When the price is above the 200-MA, the long-term trend is up; when it's below, the trend is down.
How Traders Use MAs in Practice
Dynamic Support & Resistance: Unlike horizontal lines (which are static), MAs slope up or down. In an uptrend, a rising MA acts like a moving floor—price often pulls back, touches the MA, and bounces higher. In a downtrend, a falling MA acts like a moving ceiling.
Identifying the Trend: The simplest rule is: If the MA is sloping upward, look to buy; if it is sloping downward, look to sell. If the MAs are flat and crisscrossing, the market is ranging (sideways), and MAs become unreliable.
Crossover Signals (The "Golden Cross" & "Death Cross"):
When a short-term MA crosses ABOVE a longer-term MA (e.g., the 50-day crossing above the 200-day), it is called a Golden Cross and is considered a major bullish signal.
When a short-term MA crosses BELOW a longer-term MA, it is called a Death Cross and is considered a major bearish signal.
The Magic Combination: Fibonacci + MAs
Institutions rarely use MAs alone or Fibonacci alone. They use them together.
The Confluence Zone: Imagine a stock is in an uptrend and starts pulling back. You draw your Fibonacci retracement and see the 61.8% level sits at $50. You look at your chart and notice the **200-day EMA** is also sitting right at $50.
The Result: This is a massive "confluence zone." It means two completely different mathematical models are pointing to the exact same price. When this happens, institutions pile in, and the probability of a bounce at that level skyrockets. The MA acts as the confirmation that the Fib level is legitimate.
MAs vs. Fibonacci (A Quick Comparison)
Aspect Moving Averages (MAs) Fibonacci Retracement
What it measures The average price over a specific time period. The percentage pullback of a specific price swing.
Type of Indicator Lagging (it follows price; it doesn't predict it). Leading (it projects levels where price might reverse).
Line Behavior Dynamic (slopes up/down and moves with price daily). Static (horizontal lines that remain fixed once drawn).
Primary Use Confirming trend direction and acting as dynamic support/resistance. Pinpointing exact entry points within that trend.
The Golden Rule (and Limitation)
The biggest mistake new traders make is thinking that price must bounce off a Moving Average just because it's there. Price does not respect MAs; price creates MAs.
An MA is simply a mathematical line drawn after the price has moved. In extremely volatile markets, price will slice straight through the 200-day MA without hesitation.
The Institutional Mindset: Just like with Fibonacci, institutions never buy or sell solely because price hit a Moving Average. They wait for price action confirmation—like a bullish engulfing candle or a surge in trading volume at the MA—to prove that other buyers are stepping in before they commit their capital.