KenKem MVP — XAUUSD US session scenario map (2026-08-03 12:45 UT
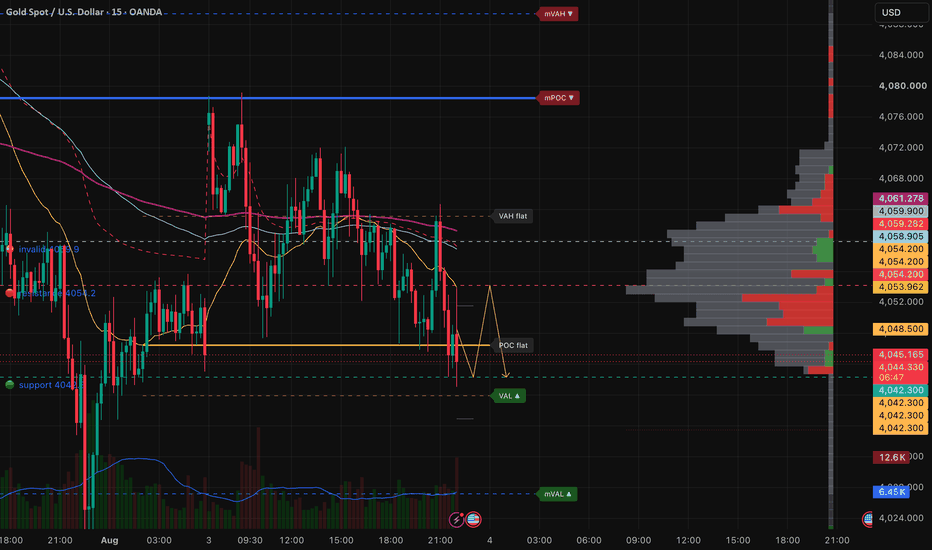
 XAUUSD
— New York session read from my KenKem Master Volume Profile (MVP) indicator & strategy.
XAUUSD
— New York session read from my KenKem Master Volume Profile (MVP) indicator & strategy.
CONTEXT
The US session is live and gold is trading beneath every reference on the M15 chart: price ~4046.7 sits under VWAP (4059.7) and under EMA25 / EMA100 / EMA200 (4054.2 / 4059.0 / 4061.3), stacked above price in a clean bearish order. On the M5 profile price has also dropped out of the value area entirely and below the master Point of Control, so the volume that built this move is now overhead supply rather than support. The net-volume read near price is saturated, meaning the node directly under price has already absorbed its flow — that argues a decisive break resolves more often than a clean bounce from the same level.
KEY ZONES
Resistance / supply: 4050.5 (master POC, just lost), then 4052.5-4054.2 (M5 value-area low + EMA25), then 4059.7-4061.5 (VWAP + EMA100 + EMA200 + M5 Point of Control + M15 value-area high — the thick wall).
Support / demand: 4045.2 (M15 Point of Control, price is sitting on it), then 4041.3-4042.3 (master value-area low + the session low), then 4028 (higher-window value-area low, still buyer-tagged).
Point of Control (volume magnet): 4045.2 on the M15 window, 4061.5 on the M5 window.
SCENARIOS (to watch — NOT signals)
Bullish: hold above 4042.3 and room opens back toward 4050.5, then the 4059.7-4061.5 wall. That band is where VWAP, the slower EMAs and the M5 Point of Control all overlap, so it has to give before any structural change.
Bearish: lose 4042.3 on a closing basis and it opens 4028, the next buyer-tagged value-area edge, with thin traded volume in between.
Range / unclear: stuck between 4042.3 and 4054.2 means standing aside until a decisive close exits the band. The profile shows most recent volume above price, so chop inside it is the base case until proven otherwise.
Invalidation: a close back above 4059.9 voids this map — that reclaims VWAP and the slower EMAs together.
WHAT THE MVP TOOL IS SHOWING
The Master Volume Profile plots rolling value areas (VAH/VAL), the Point of Control, and a net-volume pressure read to locate where volume is building or drying up, and tags each node as still-defended, net-sold, or absorbed. This idea is the qualitative output of that tool; the strategy's internal thresholds, gating and entry/exit logic are not disclosed.
Built with the KenKem Master Volume Profile indicator & strategy.
Technical analysis only, by KenKem's algorithm — NOT financial advice. Trade your own plan and manage your risk.