HOW-TO: XAUUSD 1D — Last Confirmed Turn Down, Current Structure
Introduction
For this daily XAUUSD review, I’m using Smart Trader 5.1 as a structured market-reading framework.
It combines multi-scale trend direction, move quality, geometric volume analysis, five-dimensional pressure synthesis through Trade Finder, projected leader structure, and the MEM system sensor in one view.
The goal is not to predict gold from a single reading, but to separate what the market structure is showing now from what the algorithm has actually confirmed.
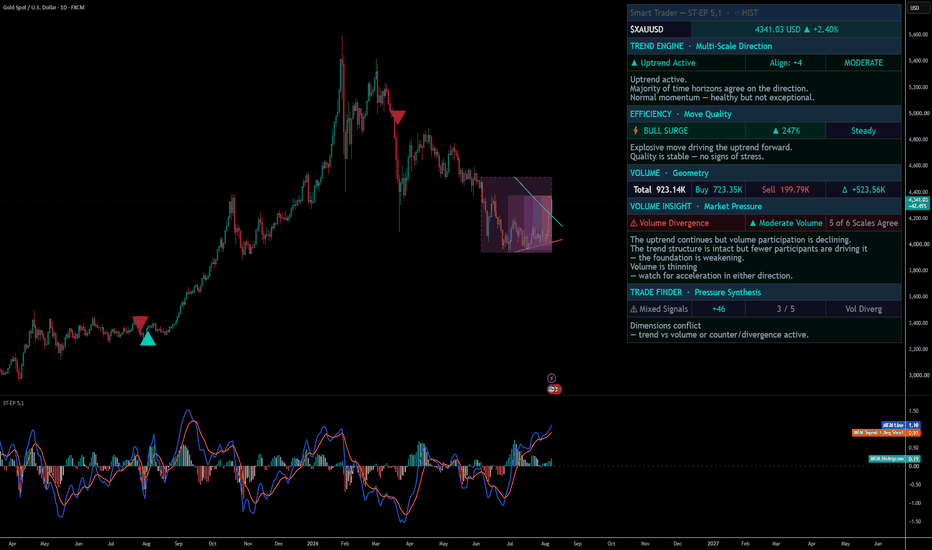
On XAUUSD 1D, the last confirmed Trade Finder mark is still bearish.
Yet on this closed historical bar, the dashboard reads Uptrend Active.
That is not a contradiction. The dashboard describes the structure of the bar being analyzed, while a Trade Finder triangle records a directional change only after the mark-confirmation conditions are fully satisfied.
So the central question is whether the developing bullish structure has become strong enough to replace the last confirmed bearish turn.
Analysis Settings
This review uses Smart Trader 5.1 with the following configuration:
Multiresolution Depth: OFF — the six base horizons are active: 3, 7, 13, 19, 29 and 47.
Ensemble Aggregation: ON — Trend, Conviction, Efficiency, Momentum and Volume are mapped into bounded directional components and combined with equal weight.
Adaptive Hysteresis: ON — an opposite-direction challenger must first satisfy the active pressure threshold and then exceed the running average strength of the currently confirmed regime before a new opposite mark can be accepted.
Net Pressure Threshold: 47 — this is the active mark threshold in Ensemble mode. The separate Confluence Threshold of 29 is inactive in this configuration.
Volume Method: Geometry — Buy and Sell volume are estimated from candle geometry rather than treated as exact tick-level order flow.
Footprint Method: Geometry — volume-at-price structure is also estimated from OHLCV geometry rather than a native tick footprint.
Leader Trend Lines: ON — refreshed every 7 confirmed bars and projected 14 bars forward.
MEM is active in 12 / 26 / 9 MACD mode.
Live intrabar alerts: OFF — confirmation alerts wait for the candle to close.
These settings matter because the dashboard can change before the stricter conditions required for a new confirmed Trade Finder mark are satisfied.
Trend Engine — Multi-Scale Direction
The dashboard reads Uptrend Active, with Align: +4 and MODERATE conviction.
With Multiresolution Depth OFF, six horizons contribute to the directional reading.
Align +4 is their net directional balance. It does not simply mean that four horizons are bullish; bullish and bearish directional votes combine into a net score of +4.
With six active horizons, +3 is enough to activate an uptrend, while +5 is required for Strong Uptrend. So +4 establishes a bullish structure without reaching the strongest trend tier.
MODERATE measures the magnitude behind that alignment. Directional agreement is established, but its weighted strength has not reached the HIGH conviction tier.
The dashboard narrative says:
“Uptrend active. Majority of time horizons agree on the direction. Normal momentum — healthy but not exceptional.”
So the current closed bar has a constructive bullish multi-scale structure, but not yet an exceptionally strong one.
Efficiency — Move Quality
The Efficiency row reads BULL SURGE, ▲ 247%, and Steady.
247% is the volatility-normalized efficiency score of the three-bar composite move. It is not a probability, expected return, or price gain, and by construction the score can exceed 100.
BULL SURGE adds context to that raw score. The three-bar move is bullish, aligned with the active trend, and its adaptive efficiency rank is in the Extreme zone relative to recent history.
Steady describes the momentum of move quality itself. Recent efficiency remains broadly stable relative to its longer baseline rather than materially accelerating or fading.
The dashboard narrative says:
“Explosive move driving the uptrend forward. Quality is stable — no signs of stress.”
So move quality strongly supports the bullish dashboard structure, while the quality of that move is currently stable rather than accelerating further.
Volume — Geometric Decomposition
For this XAUUSD review, volume is set to Geometry.
Instead of treating Buy and Sell as directly measured tick-level order flow, the method estimates their distribution from the candle itself. The position of the close within the high-low range determines how the bar’s reported volume is divided between the two sides.
The current bar reads:
Total: 923.14K
Buy: 723.35K
Sell: 199.79K
Delta: +523.56K
The geometric estimate therefore assigns substantially more of this bar’s volume to the buy side.
This is a strong positive geometric imbalance on the current bar, but it remains an OHLCV-based estimate rather than a direct measurement of executed buyer-versus-seller tick flow.
Volume Insight — Market Pressure
The broader volume layer reads Volume Divergence, Moderate Volume, and 5 of 6 Scales Agree.
Volume Divergence does not contradict the strongly positive geometric delta on the current bar.
The two readings answer different questions.
The geometric delta describes how this individual candle’s volume is distributed. Volume Divergence looks at participation over time: the trend remains established while shorter-term volume participation has fallen below its longer-term baseline.
Moderate Volume means the median volume rank across the six active horizons is in the system’s normal participation band rather than its Strong or Extreme zones.
5 of 6 Scales Agree refers to multi-scale footprint consensus. Five of the six active footprint POCs belong to the dominant cluster, with their centers located within the system’s half-ATR proximity rule.
The dashboard narrative says:
“The uptrend continues but volume participation is declining.
The trend structure is intact but fewer participants are driving it — the foundation is weakening.
Volume is thinning — watch for acceleration in either direction.”
So the price structure is bullish, but participation is not strengthening with it. This is the main weakness in the current dashboard picture.
Trade Finder — Pressure Synthesis
The Trade Finder row reads Mixed Signals, +46, 3 / 5, and Vol Diverg.
Because Ensemble Aggregation is ON, the +46 shown in the score cell is the Confluence Matrix net-pressure score used by the active chart-mark engine.
The configured bullish threshold is +47.
So the current closed bar remains below the first requirement for a bullish mark.
Reaching +47, however, would not automatically create a new bullish triangle. With Adaptive Hysteresis ON, the bullish challenger must also exceed the running average strength of the last confirmed bearish regime before a new bullish birth can be accepted.
3 / 5 is the Trade Finder consensus count. Three of its five directional dimensions currently agree with the composite direction.
The state nevertheless remains Mixed Signals because Volume Divergence is an active conflict condition.
The dashboard narrative says:
“Dimensions conflict — trend vs volume or counter/divergence active.”
So bullish pressure has developed significantly, but the algorithm has not yet accepted a new bullish directional confirmation.
Leader Trend Lines — Structural Compression
The projected Leader Trend Lines add another visible feature to the chart.
The upper line is descending while the lower line is rising, creating a converging structure.
These lines connect the 47-bar and 13-bar leader structures and extend their geometry forward.
The convergence shows compression, but it does not determine the direction of the eventual resolution. A geometric contraction is not, by itself, a bullish or bearish confirmation.
MEM — System Sensor
MEM is running its 12 / 26 / 9 MACD on the raw MEM system sensor, not on price.
The current MEM MACD line is above its signal line and the histogram is positive.
That means the combined internal sensor currently carries positive momentum.
MEM therefore supports the improving bullish internal structure, but it does not replace the separate confirmation logic used by Trade Finder marks.
What Would Confirm the Change?
There is no need to anticipate the next directional turn.
Smart Trader 5.1 already provides the built-in F01 🔺 Bullish Confluence Threshold alert for the actual bullish birth event.
With the current settings, bullish pressure must first satisfy the configured Net Pressure Threshold. Because Adaptive Hysteresis is ON, the bullish challenger must then overcome the running strength of the last confirmed bearish regime.
Only when those conditions produce a valid opposite-direction birth does F01 qualify.
With Live intrabar alerts OFF, that confirmation waits for the candle to close, keeping the alert aligned with the final confirmed chart event.
So I do not need to assume that the transition has happened. If the algorithm fully confirms it, F01 and the next bullish Trade Finder mark will identify that change.
Final Reading
The distinction is now clear.
The current XAUUSD daily structure has improved materially.
Trend Engine is Uptrend Active.
Efficiency is BULL SURGE.
The current geometric volume decomposition strongly favors the buy side.
MEM carries positive internal momentum.
But broader participation is weakening through Volume Divergence, Trade Finder remains Mixed Signals, and the active Ensemble pressure is still +46 against a bullish threshold of +47.
Most importantly, even if +47 is reached, the additional Adaptive Hysteresis condition would still need to be cleared before a new bullish birth is accepted.
Therefore, the last confirmed Trade Finder directional change remains bearish. The dashboard is showing a developing bullish structure, but under the current algorithm, calculations and settings, the conditions required to confirm a bullish turn have not yet been fully satisfied. Until a new bullish birth is confirmed and a green Trade Finder mark is produced, the last confirmed directional turn remains the bearish one.
This review is an algorithmic dashboard reading shared for educational purposes only. It is not investment advice.