
How an EMA Cloud Adds Directional Context to OTE Setups -ICT/SMC
📊 **A quick foundation: MA vs EMA**
Before using any trend filter, it helps to know what you're actually plotting.
A **Simple Moving Average (SMA)**, when calculated from closing prices, averages the last X closes with **equal weight** on every candle. Smooth and stable, but slower to react — a strong recent move gets diluted among the other candles inside the lookback window.
An **Exponential Moving Average (EMA)** also averages price, but gives **more weight to recent candles**. It reacts faster to what's happening now, which is why structure-based and intraday traders tend to prefer it. The tradeoff: a bit more noise.
Simple way to remember it: the SMA gives equal weight to every candle inside its lookback window; the EMA gives progressively more weight to recent candles.
---
🔢 **The number matters: what "EMA 50" or "EMA 100" means**
The number represents the EMA's period setting. An EMA 50 uses a faster smoothing factor than an EMA 100, which makes it more responsive to recent price movement. Older candles still influence the calculation, but their weight decreases exponentially over time.
The timeframe also matters. An EMA 50 on a 1-hour chart is calculated from hourly candles, while the same setting on a Daily chart is calculated from daily candles. The setting therefore changes not only the indicator's speed, but also the market context it reflects.
Smaller number → faster, more reactive, more noise. Larger number → smoother, broader context, slower to turn. There's no universal "best" — it's a tradeoff you tune to your timeframe and style.
---
🧭 **The EMA as a directional compass — not a signal**
Here's the key idea, and it's the same philosophy as the OTE zone: **the EMA doesn't tell you to buy or sell. It adds directional context to where you look for setups.**
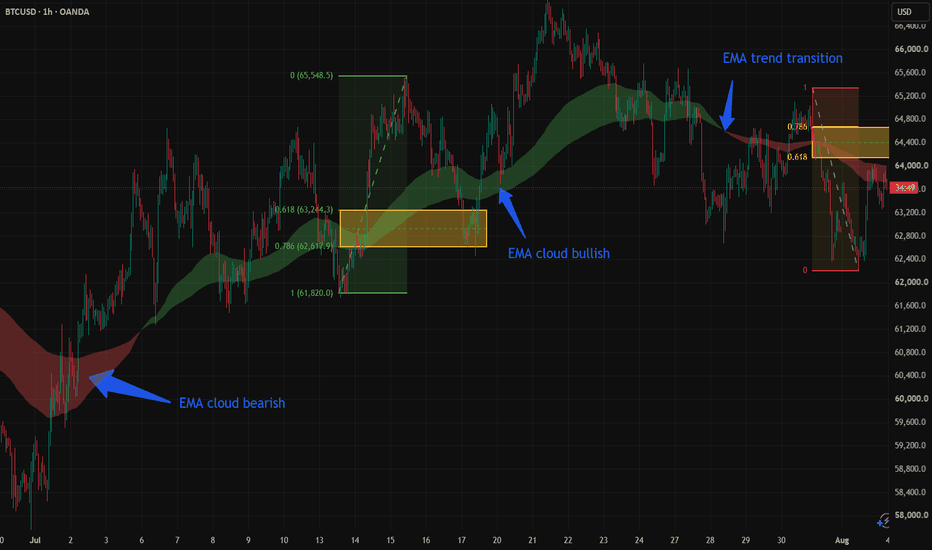
On this chart, the EMA cloud (a fast EMA and a slow EMA, with the fill between them) does one job — it frames the directional bias.
🟢 **Cloud bullish** (fast above slow) → the framework favors a bullish bias. Prioritize **long** OTE setups.
🔴 **Cloud bearish** (fast below slow) → the framework favors a bearish bias. Prioritize **short** OTE setups.
---
🔁 **Putting it together with the OTE zone**
The chart shows two historical OTE examples built from the same framework, but in opposite directions and under different EMA conditions.
**The first setup** appeared during the 🟢 **bullish** stretch. Price rallied, pulled back into the Golden Zone (0.618-0.786), and resumed higher — a long that moved *with* the cloud, not against it.
**The second setup** came later, once the market had gone through the **EMA trend transition** and the cloud had flipped 🔴 **bearish**. Identical OTE mechanics, but now the aligned trade was a short — because the directional context had reversed.
The lesson isn't that the cloud caused the move or decided which trade was right. It added directional context: the bullish OTE was aligned with a bullish cloud, the bearish OTE with a bearish cloud. The same OTE framework can be used in both directions, with the cloud acting as a filter rather than a trigger.
---
⚠️ **The counter-trend setup**
A long OTE setup while the cloud is bearish — or a short while it's bullish — is a counter-trend setup. It is not automatically invalid: it simply does not satisfy this directional filter and may require separate rules or additional confirmation. The filter flags when a setup is going against the dominant side.
---
💡 **Key takeaway**
The EMA isn't a buy/sell trigger — it's a filter. It answers one question before you even look at a zone: *which direction does the broader context favor?* Cloud up → prioritize longs. Cloud down → prioritize shorts.
And during a transition, directional clarity is reduced. A crossover is not automatically a new trend — separation and consistency between the fast and slow EMAs can help assess whether the new bias is becoming established.
The framework combines a valid swing, an OTE zone as a decision area, and a trend filter that adds directional context. The same reading framework can be applied across assets and timeframes, provided the settings are adapted to their behavior.
---
📌 This is not financial advice. Educational content only. Everyone remains responsible for their own analysis and risk management.
