HINDALCO: 1H Impulsive Breakout & Dynamic Moving Average Ribbon
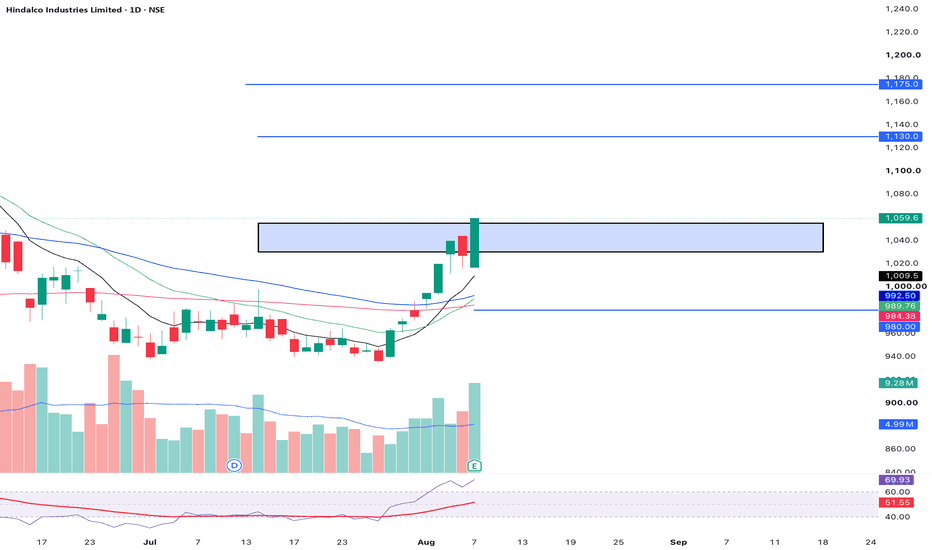
📊 Hindalco Industries Limited (HINDALCO) - 1-Hour (1H) Chart Analysis
This post is shared for EDUCATIONAL PURPOSES ONLY to analyze short-term impulse breakouts, volume expansion dynamics, and dynamic moving average stack alignment. It is not financial or investment advice.
🎯 Educational Swing Setup:
• Entry Zone: 1,030.00 – 1,055.00 (Sizing into position blocks near current levels, or accumulating on minor 1H pullbacks toward the 1,035.00 green EMA support shelf).
• Target 1: 1,130.00 (Near-term key structural supply / consensus price target zone)
• Target 2: 1,175.00 (Major 52-week peak structural retest target)
• Invalidation / Stop-Loss: 980.00 (A definitive hourly candle close back below the pink long-term EMA baseline invalidates this bullish momentum setup).
• Expected Duration: 4 to 10 Trading Days (Short-term 1H swing view)
⚠️ Risk Management:
Since the 1H RSI is currently running in strong momentum territory (78.36), a brief high-level consolidation or minor retest around the 1,035.00 zone is normal technical behavior. Keep your position sizing disciplined and manage your risk strictly!