GOOGLE 12-year Channel Up says correction isn't over.
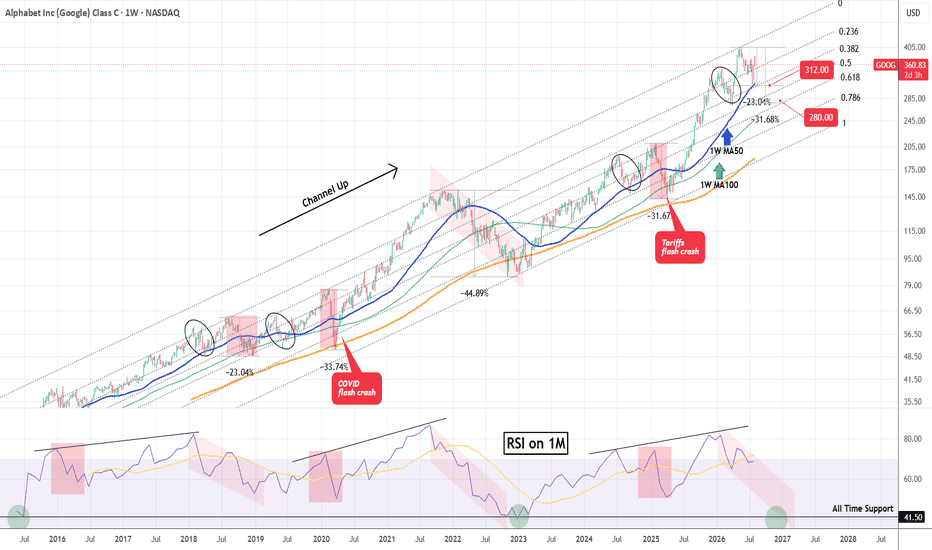
Google (GOOG) has been trading within a 12-year Channel Up since its IPO and the recent April - May massive rally has made it hit the pattern's Top (Higher Highs trend-line) for the first time since November 2021.
That was the Top that kick-started the 2022 Bear Cycle, which declined by almost -45%, bottoming just below the 1W MA200 (orange trend-line). The latter has historically been the market's long-term Support (hence optimal buy entry) as it contained both the 2025 Tariffs flash crash and the 2020 COVID flash crash.
Technically this Channel Up displays strong similarities among those fractals and the fact that May hit its top and got rejected into a new pull-back that touched the 1W MA50 (blue trend-line), further supports this argument.
Those similarities are also reflected on their 1M RSI sequences that give a strong sense of cyclical behavior. What stands out on the 1M RSI is the 41.50 Support, which has delivered the market's two most optimal multi-year buy entries (June 2015 and December 2022). If such a test occurs, it goes without saying that it is an automatic long-term buy.
So with the recent Channel Up Top rejection, the probabilities for an extended technical Bearish Leg becomes stronger. Based on the price and RSI structure, the current fractal resembles ore the 2025 Tariffs crash, the 2020 COVID crash as well as the 2018 U.S. - China Trade War correction. As you can see, those crashes were preceded by smaller corrections (ellipse patterns). We already had that now during the recent February - March (U.S. - Iran war) pull-back.
As a result, we expect Alphabet Inc. to target at least $312.00 (representing a -23.04% decline from the Top, similar to August - December 2018 correction) and if the macro environment at the time favors more selling, then move to an additional test of the 1W MA100 (green trend-line) at $280.00 by the end of the year.
---
** Please LIKE 👍, FOLLOW ✅, SHARE 🙌 and COMMENT ✍ if you enjoy this idea! Also share your ideas and charts in the comments section below! This is best way to keep it relevant, support us, keep the content here free and allow the idea to reach as many people as possible. **
---
💸💸💸💸💸💸
👇 👇 👇 👇 👇 👇