# GOLD (XAU/USD) – 15-Minute Technical Analysis
# GOLD (XAU/USD) – 15-Minute Technical Analysis
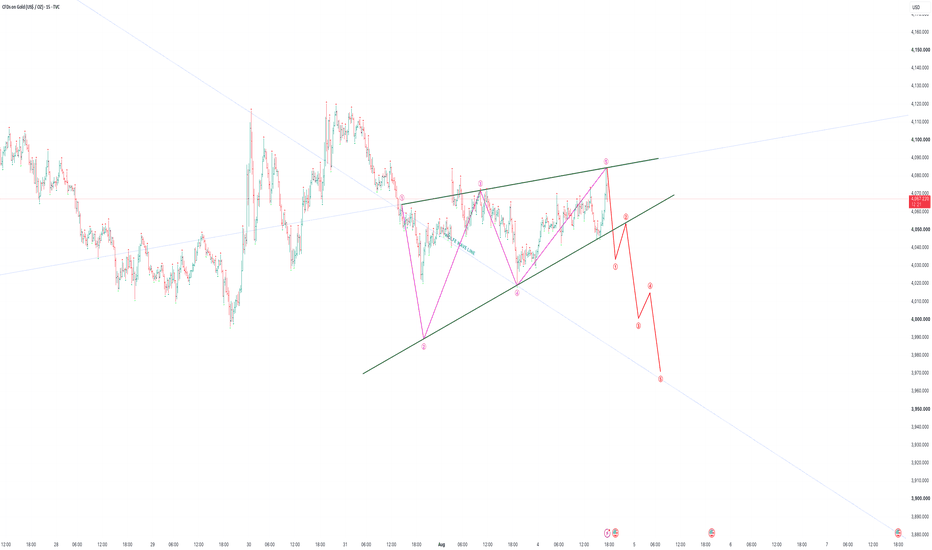
1. Gold is trading at a **critical inflection point**, where the price has completed a five-wave bullish advance (magenta structure) and is now testing the upper boundary of the rising trendline.
2. The rally has stalled near **4085–4090**, which acts as a strong resistance zone. This area coincides with the upper trendline and the completion of the impulsive bullish leg.
3. Price is now showing signs of rejection from this resistance, suggesting that buyers are losing momentum and a corrective phase may be starting.
4. The green ascending trendline is the most important support on the chart. As long as Gold remains above this trendline, the broader bullish structure remains intact.
5. A decisive **break below the ascending trendline** would confirm the beginning of a fresh bearish impulsive sequence. Your projected red Elliott Wave path (1-2-3-4-5) illustrates this potential downside scenario.
6. The first downside objective is the recent swing low near **4035–4040**. Failure to hold this support would expose **4000**, followed by **3970**, which aligns with the descending long-term trendline.
7. The larger blue descending trendline continues to act as a long-term dynamic resistance. Unless Gold breaks above this broader trendline, medium-term rallies should still be treated as corrective rather than the start of a sustained uptrend.
8. For the bearish scenario to remain valid, Gold should continue making **lower highs below 4085–4090**. Any sustained move above this resistance would invalidate the immediate bearish count.
9. From a risk-to-reward perspective, traders should wait for **confirmation of a trendline breakdown** before expecting the projected impulsive decline. Entering before confirmation increases the probability of a false breakdown.
10. **Overall Outlook:** The chart currently favors a **short-term bearish correction**. A confirmed break below the rising trendline would likely accelerate selling toward **4035 → 4000 → 3970**, while only a breakout above **4085–4090** would invalidate this bearish outlook and restore bullish momentum.
---
## Key Technical Levels
* **Immediate Resistance:** 4085–4090
* **Bullish Invalidation:** Sustained close above 4090
* **Trendline Support:** Rising green trendline
* **Immediate Support:** 4035–4040
* **Downside Targets:** 4000 → 3970
* **Overall Bias:** Short-term Bearish, Medium-term Neutral until the larger descending trendline is broken.
---
## Pattern Confidence Rating
| Parameter | Rating |
| ----------------------- | :---------------: |
| Swing Structure | ⭐⭐⭐⭐⭐ (5/5) |
| Trendline Accuracy | ⭐⭐⭐⭐☆ (4.5/5) |
| Elliott Wave Projection | ⭐⭐⭐⭐☆ (4/5) |
| Risk-to-Reward | ⭐⭐⭐⭐⭐ (5/5) |
| Overall Reliability | **⭐⭐⭐⭐☆ (4.4/5)** |
### Disclaimer
> **Disclaimer:** This analysis is based on technical chart patterns, Elliott Wave projections, trendline analysis, and price action. It is intended **solely for educational and informational purposes** and **should not be considered financial or investment advice**. Financial markets are inherently volatile, and no technical analysis can guarantee future price movements. Always conduct your own research, use proper risk management, and consult a qualified financial advisor before making any trading or investment decisions.