Gold Wave Analysis – 7 August 2026
Gold Ounce vs US Dollar FXPRO:XAUUSD
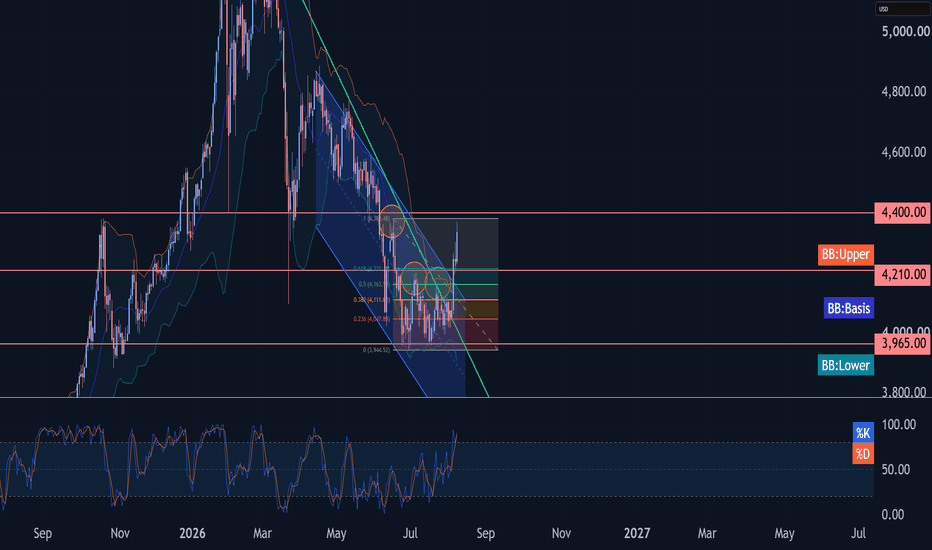
– Gold broke resistance zone
– Likely to rise to resistance level 4400.00
Gold recently reversed broke the resistance zone between the long-term resistance level 4210 (top of wave 1 from July) and the 61.8% Fibonacci correction of the downward impulse from June.
The breakout this resistance zone accelerated the active short-term impulse wave iii from the end of July.
Gold can be expected to rise further to the next resistance level 4400.00 (top of wave iv from June and the target for the completion of wave 3).