Gold Technical Analysis | High-Probability Buy Setup from Demand
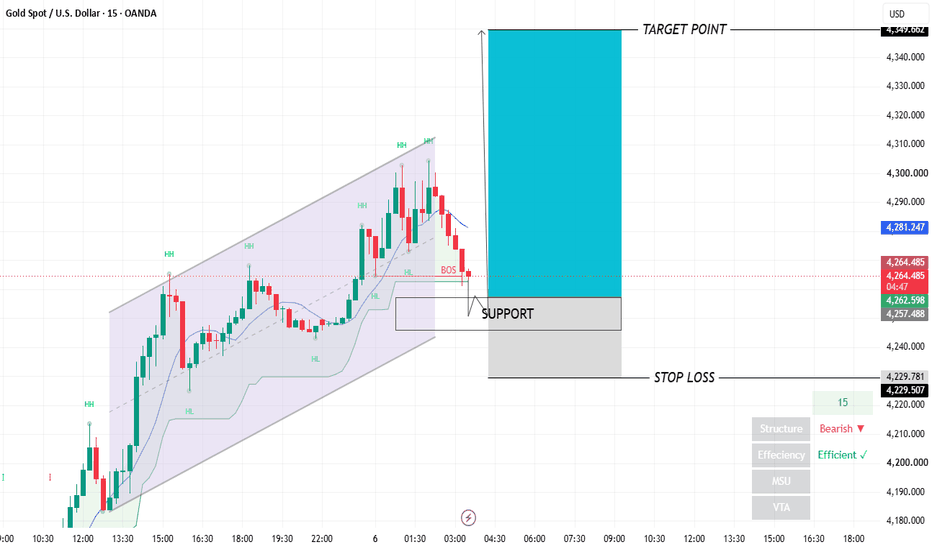
XAU/USD (Gold) 15M Technical Analysis
Market Bias: Bullish (Buy the Dip)
The chart shows that price has pulled back after breaking below short-term structure (BOS), but the overall trend remains bullish as the market is still trading within the context of the previous ascending channel. The highlighted gray zone is acting as a key demand/support area where buyers may step back into the market.
Key Observations
Trend: Overall bullish despite the recent correction.
Structure: A short-term bearish BOS has occurred, suggesting a temporary retracement rather than a confirmed trend reversal.
Support Zone: 4257–4248 (gray demand area).
Resistance: 4295–4312 (recent swing highs).
Target Zone: 4345+ if buyers regain momentum.
Trade Idea (Educational)
Entry: Wait for bullish confirmation from the support zone (bullish engulfing, strong rejection wick, or higher low).
Stop Loss: Below 4229 (as marked on the chart).
Take Profit 1: 4295
Take Profit 2: 4312
Take Profit 3: 4345
What to Watch
A strong bullish reaction from the highlighted support would increase the probability of continuation toward the target zone.