Gold Recovering From Support | Bullish Structure Under Observati
Gold OANDA:XAUUSD
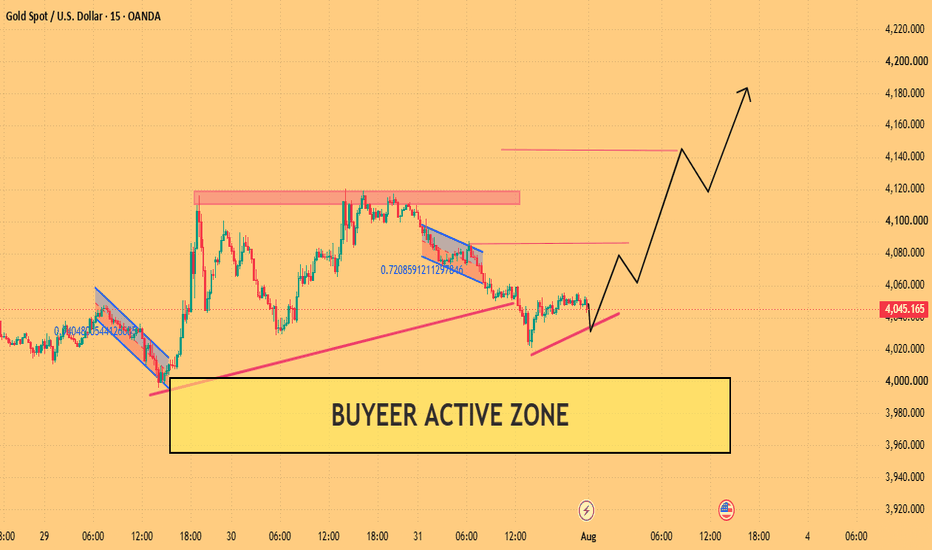
The chart shows price respecting an ascending support trendline while finding demand inside the highlighted buyer area. As long as this structure remains intact, the market may continue attempting higher levels.
The resistance zone near 4110–4120 is the next technical barrier. A successful move above this area could open the door for additional upside.
Market Structure:
Trend: Short-term recovery
Demand Area: 4020–4040
Resistance Area: 4110–4120
Possible Price Objectives:
TP1: 4065
TP2: 4095
TP3: 4120
TP4: 4165–4180
This analysis reflects the current chart structure only and should be updated if price action changes.