Gold Analysis & Trading Strategy | August 3
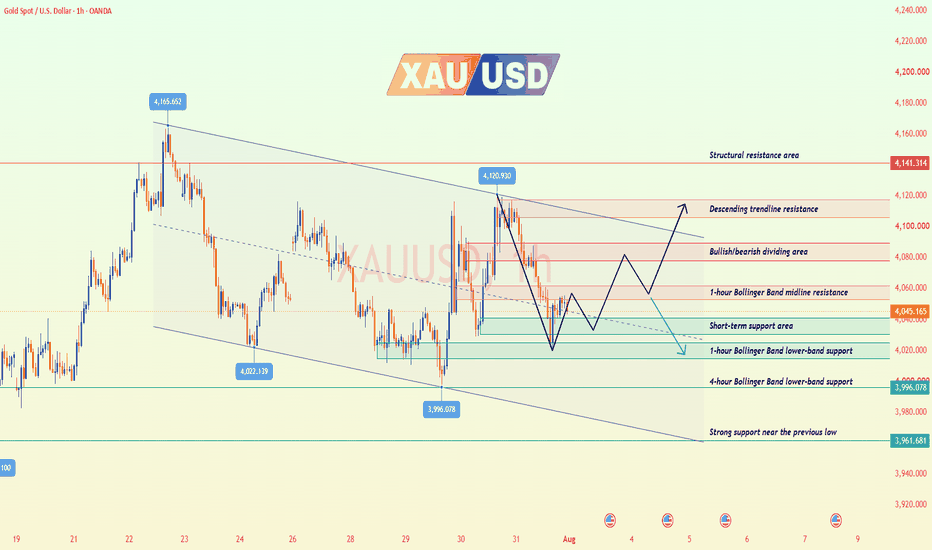
✅ 4-Hour Trend Analysis
From the 4-hour timeframe, gold peaked near 4166 and has continued to form lower highs. The descending trendline remains valid, and the overall structure is still range-bound with a bearish bias, although the medium-term key support has not yet been broken. The outlook will improve only if the price regains 4055 and then breaks above the 4084–4090 area. A further breakout above 4110–4116 could open additional upside potential. If the price falls below 4033, it may retest the 3995–3992 area.
✅ 1-Hour Trend Analysis
From the 1-hour timeframe, gold has continued to decline from around 4120. After reaching a low near 4025, the price staged a technical rebound, but the recovery has so far been capped around 4055. Since the indicators remain below the zero line, the current move is more likely a weak corrective rebound rather than a confirmed bullish reversal. If the price regains and holds above 4058, it may continue towards 4078, 4084 and 4090. If it breaks below 4040 and then loses 4033, it may fall back towards 4026. A further break below 4025 would shift the downside target towards 4000–3995.
🔴 Key Resistance Levels
● 4055–4060: 1-hour Bollinger Band midline resistance
● 4078–4090: Bullish/bearish dividing area
● 4105–4116: Descending trendline resistance
● 4139–4140: Structural resistance area
🟢 Key Support Levels
● 4040–4033: Short-term support area
● 4026–4018: 1-hour Bollinger Band lower-band support
● 3995–3992: 4-hour Bollinger Band lower-band support
● Around 3956: Strong support near the previous low
✅ Trading Strategy Reference
🔰 Short-Term Buy Strategy on a Pullback to Support
👉 Buy Zone 1: 4035–4025
👉 Buy Zone 2: 3998–3990
🎯 Targets: 4058 → 4078/4084 → 4105
🛑 The 4-hour trend remains weak. Long positions should only be considered after the price shows a clear stabilisation signal, forms a bullish reversal candlestick near support, or regains a key price level.
🔰 Sell-on-Rebound Strategy at Resistance
👉 Sell Zone 1: 4055–4065
👉 Sell Zone 2: 4080–4095
🎯 Targets: 4040 → 4026 → 3995
🛑 If the price breaks above and holds above 4095 on the 1-hour chart, further short positions should be approached with caution. If it subsequently breaks above 4116, the current bearish structure should be reassessed.
🔔 If you find my analysis helpful, please like, share, and stay tuned for future updates. Your support is my motivation to continue sharing professional insights. Wishing everyone smooth trading and steady profits!