GFM - Potential bullish sentiment
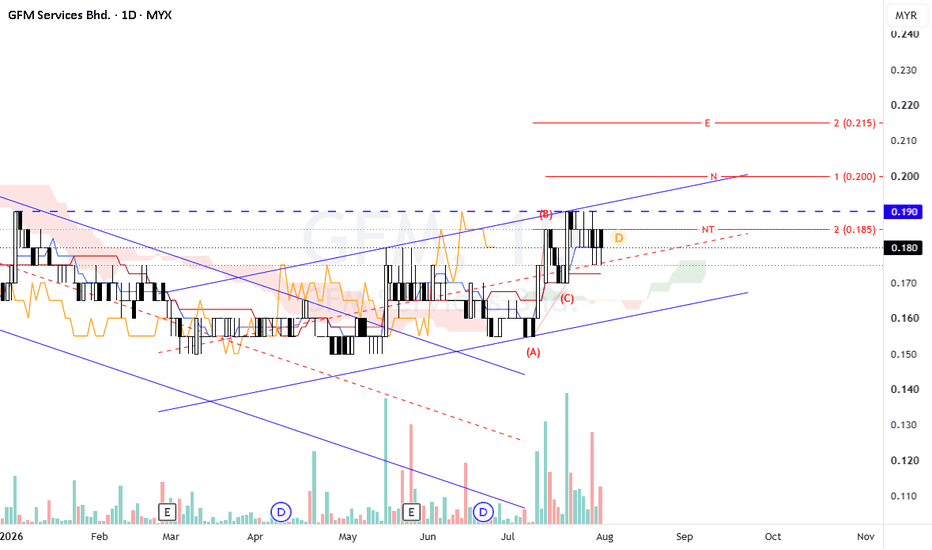
N wave with E, N & NT projection.
The overall structure appears constructive but still at a decision point. The stock has recently broken out of a longer-term descending resistance and is now forming a bullish ascending channel. The important observation is that price has already recovered strongly from the RM0.155–0.160 region and is now consolidating around RM0.180, just below the first significant resistance at RM0.185.
A decisive breakout above RM0.185 (NT level) would be technically positive, particularly if accompanied by increasing volume. The price should ideally close above RM0.185 rather than merely touching it intraday.
RM0.185 is therefore the immediate breakout trigger.
If GFM successfully breaks RM0.185 and establishes support above it, the probability of a move toward RM0.200 improves significantly.
Support Zones
RM0.175–0.180 — Immediate support
This is the first area I would monitor. The price is currently hovering around this zone.
A successful hold here keeps the short-term bullish setup intact.
RM0.170 — Key technical support
This is more important. A break below RM0.170 would weaken the current bullish structure and could indicate that the recent rebound is losing momentum.
RM0.155–0.160 — Major structural support
This is the A-wave/base region. A decline back into this area would significantly damage the bullish N-wave setup.
Resistance Zones
RM0.185 — Immediate resistance / NT target
First breakout level.
RM0.190 — Major breakout confirmation zone
The chart shows RM0.190 as a significant horizontal resistance area. A close above this level would provide stronger confirmation of bullish continuation.
RM0.200 — N target
Main target and psychological resistance.
RM0.215 — E target
Extended target.
From the chart, the price appears to be interacting with the Ichimoku cloud and has recovered from below the cloud region.
The setup is improving because:
Price has recovered from the lower base.
The recent rebound created a higher low around RM0.170.
The price is approaching the RM0.185–0.190 resistance band.
The broader rising blue trendline provides a potential dynamic support structure.
However, a clean breakout with volume before considering the N-wave fully confirmed.
The biggest technical risk is a false breakout around RM0.185–0.190, followed by a drop below RM0.175.
Entry Strategies:
Aggressive Entry: Enter near the current price of 0.180, anticipating the continuation of the wave. This offers a better risk-to-reward ratio but carries the risk of rejection at the 0.190 resistance.
Conservative Entry: Wait for a confirmed daily close above the major resistance at 0.190 with above-average volume. This confirms the N-wave is fully in motion toward the higher targets.
Stop Loss (SL):
Strict SL: 0.165. Place the stop loss just below the Wave (C) pivot low and the lower ascending blue trendline. If the price drops below this level, it prints a lower low, completely invalidating the bullish N-wave thesis.
Notes:
1. Analysis for education purpose only.
2. Trade at your own risk.