EURUSD
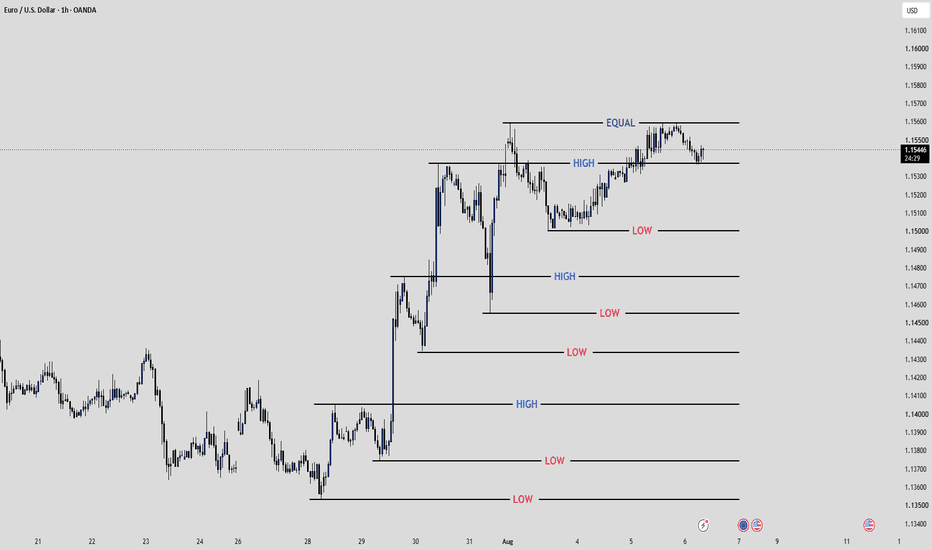
EUR/USD Technical Analysis (1-Hour Time Frame)
The EUR/USD 1-hour chart illustrates a market that has transitioned from a prolonged consolidation into a strong bullish expansion. Following a decisive impulsive breakout from the lower trading range, buyers established control and drove price toward the 1.1560 resistance area. Since reaching this premium zone, the market has shifted into a consolidation phase characterized by repeated tests of resistance and shallow pullbacks, suggesting that the bullish trend remains intact despite short-term profit-taking.
Overall Market Structure
The higher-timeframe structure remains bullish, with price consistently creating higher highs and higher lows after the breakout.
Initially, EUR/USD traded within a relatively narrow range around 1.1360–1.1410, where buyers and sellers remained balanced. This equilibrium ended with a powerful bullish impulse that broke above multiple resistance levels, confirming a structural shift in favor of buyers.
The rally established several new swing highs while previous resistance levels transformed into support, demonstrating a healthy bullish market structure.
Current Price Action
At the time of the chart, price is trading around 1.1544, just below the major resistance zone near 1.1560.
After reaching this resistance, the market failed to produce a decisive breakout and instead formed several equal highs, indicating that sellers are actively defending this level.
Rather than reversing sharply, price has produced only a modest pullback toward previous resistance, now acting as support near 1.1535–1.1540. This suggests buyers are still willing to accumulate on dips.
The recent candles display reduced momentum compared to the earlier rally, reflecting temporary consolidation rather than a confirmed bearish reversal.
Bullish Impulse Phase
The chart clearly shows one dominant impulsive move beginning near 1.1380.
Characteristics of this bullish impulse include:
Strong bullish displacement candles.
Consecutive higher highs.
Minimal retracements during the advance.
Break of multiple resistance levels.
Expansion in market volatility.
This type of price behavior reflects aggressive institutional buying and a clear shift in market sentiment.
Key Resistance Levels
1. Equal Highs (Major Liquidity Zone)
Approximately 1.1560
This is the most significant resistance shown on the chart.
Multiple swing highs have formed at nearly identical prices, creating what is commonly referred to as Equal Highs (EQH).
Equal highs are important because:
Buy-stop liquidity often accumulates above them.
Institutions may target this liquidity before determining the next directional move.
A breakout above equal highs often produces strong momentum if buying pressure remains dominant.
This area should be monitored closely for either:
A confirmed bullish breakout, or
A liquidity sweep followed by bearish rejection.
2. Intermediate High
Approximately 1.1538–1.1542
This previous swing high now serves as the first support beneath current price.
Price has already reacted positively from this level, suggesting buyers are defending it.
As long as EUR/USD remains above this zone, the immediate bullish bias remains valid.
Key Support Levels
Several support levels are marked throughout the chart, representing previous swing lows that define the bullish trend.
First Support
1.1535–1.1540
This level aligns with the recent pullback low and previous breakout area.
Holding above this support would indicate continued buyer strength.
Second Support
Around 1.1500
This is the most recent higher low created after the previous correction.
A decline toward this level would still maintain the current bullish structure.
Third Support
1.1475–1.1480
This area represents the previous breakout structure before the latest rally.
If price retraces here, buyers may attempt another accumulation phase.
Fourth Support
1.1450
A stronger demand zone where buyers previously entered aggressively.
A move into this region would represent a deeper correction rather than a trend reversal.
Fifth Support
1.1435
This support originates from the earlier impulsive breakout.
Breaking below this level would weaken short-term bullish momentum significantly.
Lower Structural Supports
Additional support levels are visible near:
1.1400
1.1370
1.1350
These zones represent the original consolidation base from which the bullish trend began.
Liquidity Analysis
The chart highlights an important liquidity concept.
Buy-Side Liquidity
The equal highs near 1.1560 contain concentrated buy-stop orders.
Professional traders often monitor these levels because markets frequently seek liquidity before making larger directional moves.
Two outcomes are possible:
Price breaks above equal highs and continues higher.
Price briefly sweeps above the highs, triggers stop orders, then reverses lower.
Sell-Side Liquidity
Every marked swing low contains resting sell-side liquidity.
If the market experiences a deeper retracement, these lows become potential targets before buyers step back into the market.
Trend Assessment
The trend remains bullish because:
Higher highs continue to form.
Higher lows remain intact.
Previous resistance has become support.
Price remains above all major structural demand zones.
Until a lower low is created below the recent swing structure, buyers retain control.
Bullish Scenario
The bullish outlook remains valid if price:
Holds above 1.1535.
Breaks decisively above 1.1560.
Closes above the equal highs with strong bullish momentum.
Such a breakout would confirm continuation of the existing uptrend and signal renewed buying interest.
Bearish Scenario
A bearish correction becomes more likely if:
Price loses 1.1535 support.
Sellers push below 1.1500, creating the first lower low.
Momentum shifts toward the lower support zones around 1.1475 and 1.1450.
This would likely represent a corrective move within the broader uptrend unless additional lower highs and lower lows develop.
Trading Outlook
The market is currently positioned at a critical decision point. Price is consolidating directly beneath a significant resistance area formed by equal highs, while nearby support continues to hold. This compression indicates that volatility may increase as the market decides its next direction.
Bullish confirmation: A sustained break and close above 1.1560 would expose fresh upside potential and reinforce the prevailing bullish structure.
Bearish confirmation: A break below 1.1535, followed by a loss of 1.1500, would signal a deeper corrective phase toward lower support zones.
Conclusion
The EUR/USD 1-hour chart remains constructively bullish, with buyers maintaining control after a strong impulsive rally. The current consolidation beneath 1.1560 reflects a pause in momentum rather than a confirmed reversal. The equal highs represent a major liquidity pool and the most important level on the chart. A breakout above this resistance would likely extend the uptrend, while failure to hold the nearby support at 1.1535–1.1540 could trigger a healthy retracement toward 1.1500 or 1.1475 before the broader bullish trend resumes.