El-Nile Co. for Pharmaceuticals & Chemical Industries — Weekly C
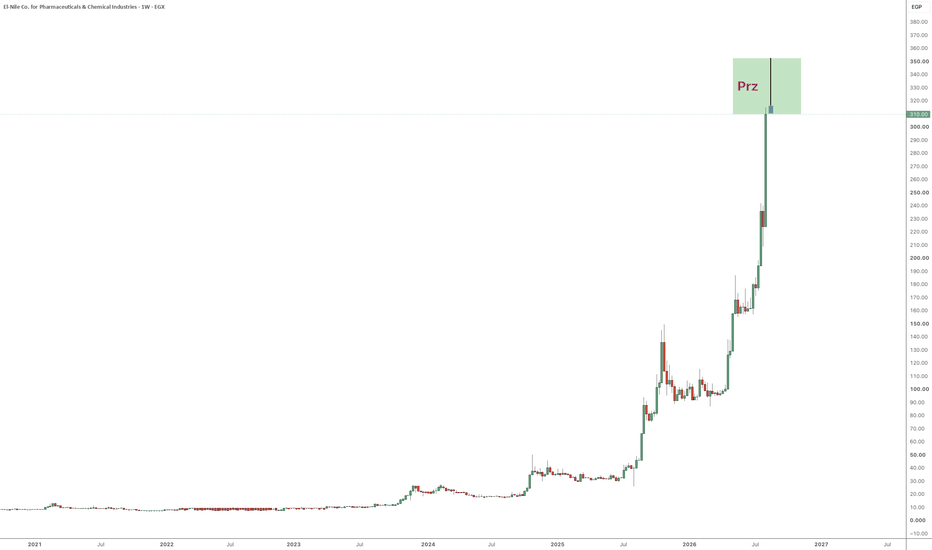
Technical Analysis — El-Nile Co. for Pharmaceuticals & Chemical Industries — Weekly Chart
The stock is in a very strong bullish trend. Price has moved from a long accumulation phase below EGP 40 into a sharp parabolic rally, now trading around EGP 310, with the current weekly candle showing a strong gain of about +38%.
Trend Status
The major trend is clearly bullish, supported by a sequence of strong breakout candles and expanding momentum. The move from the 90–110 area to above 300 was very aggressive, suggesting strong demand and possible speculative momentum.
PRZ / Target Zone
The highlighted green area around EGP 310–350 acts as a Potential Reversal Zone (PRZ). Price has already entered this zone, so the stock is now in a sensitive area.
This does not automatically mean sell, but it means the risk of short-term exhaustion is increasing, especially after such a vertical move.
Key Resistance Levels
The main resistance zone is:
310 – 350 EGP
A weekly close above 350 would confirm continuation strength and may open the way toward:
370 – 400 EGP
Key Support Levels
Important support areas are:
300 – 310: immediate support / current breakout area
240 – 250: first strong pullback support
200 – 220: secondary support
160: major trend support
100 – 110: previous consolidation base
Momentum Reading
The move is extremely powerful, but also overextended. Vertical rallies often continue longer than expected, but they also carry a higher risk of sharp corrections once momentum slows.
A warning signal would appear if the stock forms:
a long upper wick inside the PRZ,
a bearish engulfing candle,
a weekly close below 300,
or strong volume with failure to continue above 350.
Trading View
For holders, the chart supports profit protection or partial profit-taking inside the 310–350 zone.
For new buyers, the risk is high at the current level. A safer entry would usually come either after a breakout above 350 with confirmation, or after a pullback toward support.
Summary
The chart is strongly bullish, but price is now inside a potential exhaustion / reversal zone. The best technical approach is to treat 310–350 as a decision area: continuation above 350 is bullish, while failure below 300 may trigger a correction toward 240–250.