DEEP INDUSTRIES
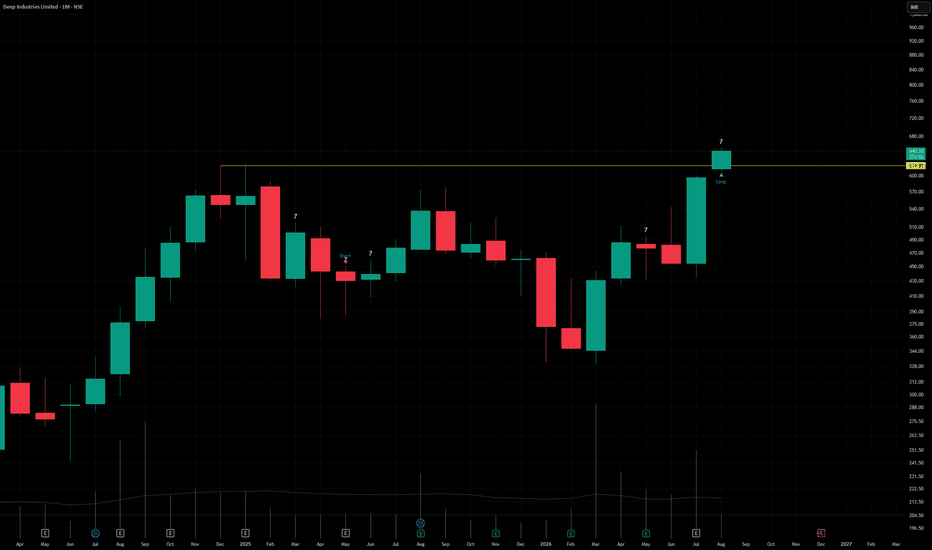
Deep Industries Ltd. (CMP ₹649.00, NSE: DEEPINDS)
The SmartWay Research Desk | 4 August 2026
A Ahmedabad‑based energy services company, incorporated in 1991. Deep Industries operates across oil & gas services, natural gas compression, exploration support, and renewable energy initiatives, serving ONGC, Oil India, and other major energy players.
Promoter Holding (Mar 2026): Shah Family — 63.5% stake (no pledges)
FY22–FY26 Snapshot
Revenue Growth: FY26 revenue ₹1,842 Cr vs ₹1,612 Cr in FY25 (+14.3% YoY). → Good
Net Profit: FY26 PAT ₹312 Cr vs ₹268 Cr in FY25 (+16.4% YoY). → Good
Operating Margin: FY26 EBITDA ₹512 Cr, margin 27.8% vs 26.9% last year (+90 bps). → Good
Equity Capital: Stable, face value ₹10. → Good
Dividend Policy: Dividend ₹6.00/share declared for FY26. → Good
Asset Building: Investments in gas compression facilities and renewable energy projects. → Good
Sales: Strong demand from oil & gas exploration and compression services. → Good
Expense: Raw material and infra costs remain volatile. → Neutral/Good
EPS: FY26 EPS ₹9.25 vs ₹7.95 last year (+16.4%). → Good
Institutional Interest & Ownership Trends (Mar 2026)
Promoter Holding: 63.5% (no pledges)
FII Holding: 10.12%
DII Holding: 15.34%
Retail & Others: 11.04%
Strategic Moves & Innovations
Expansion in gas compression and exploration support services.
Focus on renewable energy diversification (solar & wind projects).
Partnerships with ONGC and Oil India for long‑term contracts.
Diversification into international oilfield services markets.
Cash Flow & Balance Sheet Strength
Market cap ~₹6,200 Cr.
Debt‑to‑equity ratio ~0.38 (moderate leverage).
Book value per share ₹182.40; P/B ~3.6.
EPS (TTM) ₹9.25; P/E ~70.1.
Risk Factors
High P/E ratio ~70.1, valuations stretched.
Dependence on oil & gas exploration cycles.
Exposure to commodity price volatility and regulatory risks.
Competition from Oil India, ONGC, and Selan Exploration.
Investor Takeaway
Deep Industries has delivered steady FY26 performance, supported by oil & gas services demand, gas compression expansion, and renewable diversification. With strong promoter backing, dividend payouts, and leadership in niche energy services, Deep Industries remains a mid‑cap energy services play. At CMP ₹649.00, valuations are expensive (P/E ~70.1, P/B ~3.6), reflecting growth expectations but also sectoral risks.