BTC $64,941.00 ▲ 1.07% ETH $1,915.63 ▲ 0.98% USDT $0.9995 ▲ 0.03% BNB $592.95 ▲ 0.51% XRP $1.04 ▲ 1.66% SOL $74.69 ▲ 2.93% DOGE $0.0701 ▲ 1.65% SHIB $0.00000464 ▲ 0.22% PEPE $0.00000285 ▲ 2.26% BTC $64,941.00 ▲ 1.07% ETH $1,915.63 ▲ 0.98% USDT $0.9995 ▲ 0.03% BNB $592.95 ▲ 0.51% XRP $1.04 ▲ 1.66% SOL $74.69 ▲ 2.93% DOGE $0.0701 ▲ 1.65% SHIB $0.00000464 ▲ 0.22% PEPE $0.00000285 ▲ 2.26%
İçerik Alanı728x90
Piyasa

Chart Pattern Analysis Of NVDA.

Chart Pattern Analysis Of NVDA.

NVIDIA Corporation BATS:NVDA
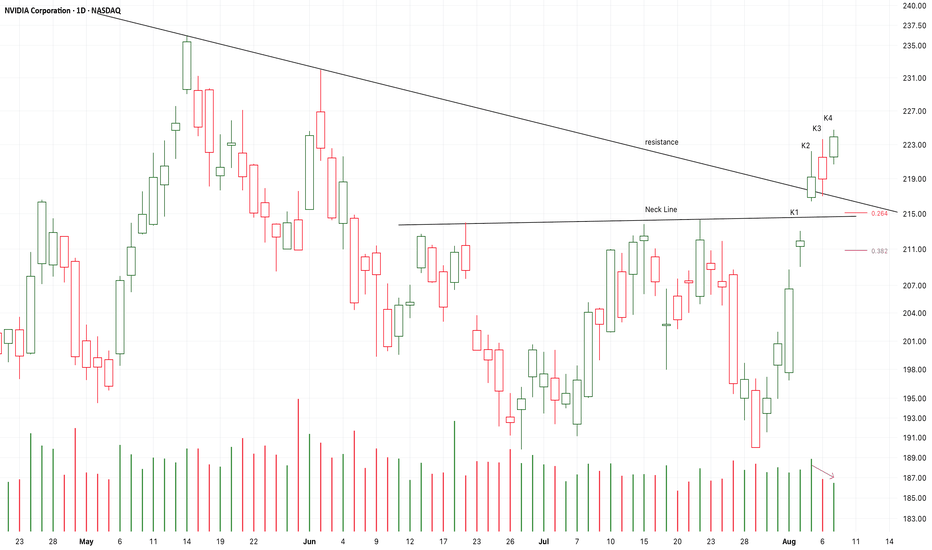
From K1 to K3,
It is a short-term consolidation channel,
It is breaking up the resistance.
The supply pressure keeps decreasing.

After breaking up the resistance and the neck line of a potential double bottom pattern.
K3 tested the resistance line for a first time.
I bought it at K4 with a small position.
If the following candles test the resistance for more times,
I will still try to buy it.


İlgili Haberler

Yorumlar (0)

Yorum yapmak için giriş yapın.

Henüz yorum yapılmamış. İlk yorumu siz yapın.

İçerik Alanı728x90