
C98USDT — DESCENDING TRENDLINE BREAKOUT SETUP?
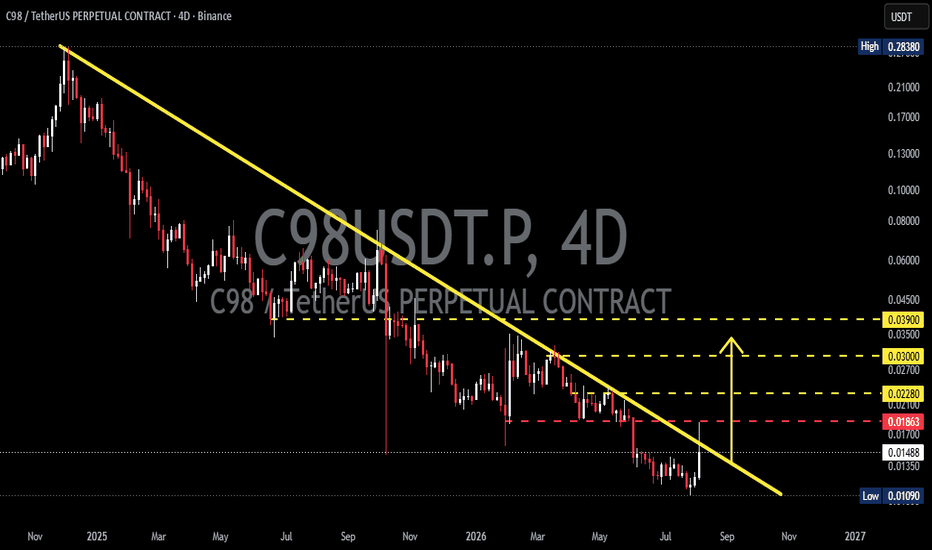
💵 $C98 | ⏳ 4D Time Frame
📉 Pattern: Descending Trendline
🎯 Key Resistance: 0.01863 → 0.02280 → 0.03000 → 0.03900
---
🔎📊 MARKET STRUCTURE
📉 C98 is still trading inside a long-term bearish structure, with the price repeatedly forming lower highs and lower lows.
🟡 The major Descending Trendline has acted as dynamic resistance since the 2025 high around 0.28380. Every major recovery has struggled to break and hold above this trendline.
🟢 However, the latest price action shows a potential attempt to recover from the recent low around 0.01090, with bullish momentum beginning to appear.
⚠️ The key confirmation is a breakout and 4D candle close above the Descending Trendline. A temporary wick above it would not be sufficient confirmation.
---
🟢🚀 BULLISH SCENARIO
🚀 If C98 successfully breaks and closes above the Descending Trendline, it could signal the first meaningful attempt to invalidate the long-term bearish structure.
📌 0.01863 — First important resistance / confirmation area.
🎯 0.02280 — First major upside target.
🎯 0.03000 — Next resistance and potential continuation target.
🎯 0.03900 — Major resistance and higher-timeframe target.
🔥 A sustained move above 0.02280 would strengthen the bullish scenario and could open the way toward 0.03000–0.03900.
📈💥 The chart suggests a potential 10%+ short-term move if the breakout receives sufficient buying volume and momentum.
---
🔴📉 BEARISH SCENARIO
⚠️ If C98 fails to break the Descending Trendline and gets rejected, the long-term bearish structure remains intact.
📉 A rejection followed by a break below 0.01488 would indicate that buyers are losing control.
🔻 Continued weakness could bring the price back toward the recent low around 0.01090.
🚨 A decisive breakdown below 0.01090 would create the risk of another lower low and further continuation of the long-term downtrend.
---
🧩📐 PATTERN EXPLANATION — DESCENDING TRENDLINE
📉 The Descending Trendline connects a series of lower highs and represents persistent selling pressure.
🔴 As long as price remains below this trendline, sellers maintain the broader structural advantage.
🟢 A confirmed 4D breakout + candle close above the trendline would be an important technical development because it could indicate that the long-standing bearish trend is weakening.
⚠️ However, the breakout should ideally be accompanied by strong volume 📊 and follow-through 🚀, otherwise it could become a false breakout ❌.
---
🎯📍 KEY LEVELS TO WATCH
🟢 0.01863 — Breakout / confirmation zone
🎯 0.02280 — First major target
🎯 0.03000 — Second target
🎯 0.03900 — Major resistance / extended target
🔴 0.01488 — Important support
🔻 0.01090 — Major recent low
---
🧠🔥 CONCLUSION
🔥 C98 is approaching a critical decision area. The long-term trend remains bearish, but a confirmed breakout above the Descending Trendline could trigger a significant relief rally and potentially change the short-term market structure.
📌🟢 Bullish confirmation: 4D close above the Descending Trendline + follow-through.
📌🔴 Bearish confirmation: rejection from the trendline + loss of 0.01488, especially if 0.01090 breaks.
👀📈 The trendline breakout is the key level to watch.
⚡ Breakout = potential bullish momentum.
⚠️ Rejection = bearish structure remains valid.
---
#C98 #C98USDT #Crypto #CryptoAnalysis #TechnicalAnalysis #Altcoins #AltcoinAnalysis #PriceAction #CryptoTrading #Bullish #Bearish #DescendingTrendline #Breakout #CryptoMarket #Trading #TechnicalTrader
