
AVAUSDT — DESCENDING TRENDLINE TESTING A KEY BREAKOUT ZONE!
⏳ Time Frame: 3D | 🏦
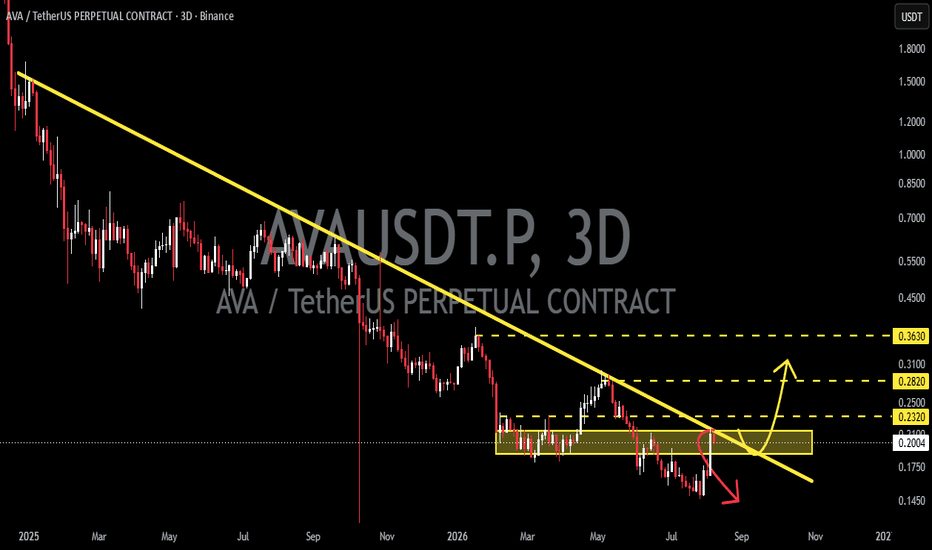
AVA/USDT is still trading below the major 📉 Descending Trendline that has been putting pressure on the price since early 2025. Currently, the price is around 💵 0.2006 USDT and is testing an important area that could determine the next major move. ⚔️
📉🔻 PATTERN: DESCENDING TRENDLINE 📐
🔻 The Descending Trendline represents a bearish structure, as the price has consistently formed Lower Highs 📉 and continues to face selling pressure whenever it approaches the resistance line.
📌 The yellow trendline is acting as the main 🟡 Dynamic Resistance. As long as the price remains below this line, the medium-term bearish structure remains valid.
⚠️ However, the price is now very close to the trendline and the 🟡 Yellow Support/Resistance Zone, making this a critical decision area to determine whether AVA can achieve a breakout 🚀 or face another rejection 📉.
---
🟢🚀 BULLISH SCENARIO
🟢 Bullish confirmation would become stronger if AVA manages to break above the 📉 Descending Trendline and achieve a 3D Candle Close 🕯️ above it.
🔥 If this breakout is successfully confirmed, the bearish structure could begin to lose strength, potentially opening the door for a reversal 🔄 or further recovery 📈.
🎯 Target 1: 0.2320
🎯 Target 2: 0.2820
🎯 Target 3: 0.3630
📈 The 0.2820–0.3630 area becomes the next major resistance zone to watch if bullish momentum continues to strengthen 💪🚀.
💡 🔑 Key Condition: Do not rely only on a breakout wick ⚠️. A 3D Candle Close 🕯️ above the Descending Trendline would provide a much stronger confirmation ✅.
---
🔴📉 BEARISH SCENARIO
🔴 If the price receives another rejection ❌ from the Descending Trendline, AVA could continue its bearish structure 📉.
⚠️ Bearish confirmation would become stronger if the price loses the 🟡 Yellow Zone and begins forming a new Lower Low 📉.
📉 If this support area fails to hold, selling pressure could increase 📊 and potentially push the price toward:
🎯 0.1750
🎯 0.1450
🚨 A strong breakdown below the support area could indicate that the bullish breakout has failed to materialize and that the bearish structure remains dominant 🔻.
---
🟡⚔️🔑 MOST IMPORTANT AREA
🟡 The Yellow Zone is currently the main ⚔️ Decision Point.
📌 🟢 Hold & Breakout: Could open the way toward 0.2320 → 0.2820 → 0.3630 🚀📈
📌 🔴 Rejection & Breakdown: Could send the price back toward 0.1750 → 0.1450 📉💥
⚔️ Therefore, AVA is currently in a battle between Buyers 🟢 and Sellers 🔴, right around the 📉 Descending Trendline.
---
🧠📊 CONCLUSION
📉 Main Trend: Bearish
📐 Pattern: Descending Trendline
⚔️ Current Situation: Testing Major Resistance
🟡 Key Zone: Yellow Zone
🟢 Bullish Trigger: 3D Close Above Descending Trendline
🔴 Bearish Trigger: Rejection + Breakdown Below Yellow Zone
🎯 Bullish Targets: 0.2320 → 0.2820 → 0.3630
📉 Bearish Targets: 0.1750 → 0.1450
🔥 AVA/USDT is approaching a critical breakout point.
⏳ The next confirmed move around the 📉 Descending Trendline could determine the next major direction. 🚀⚔️
#AVA #AVAUSDT #Crypto #CryptoAnalysis #TechnicalAnalysis #Altcoins #AltcoinAnalysis #PriceAction #DescendingTrendline #Breakout #Bullish #Bearish #CryptoTrading
