AUDNZD | Elliott Wave Analysis
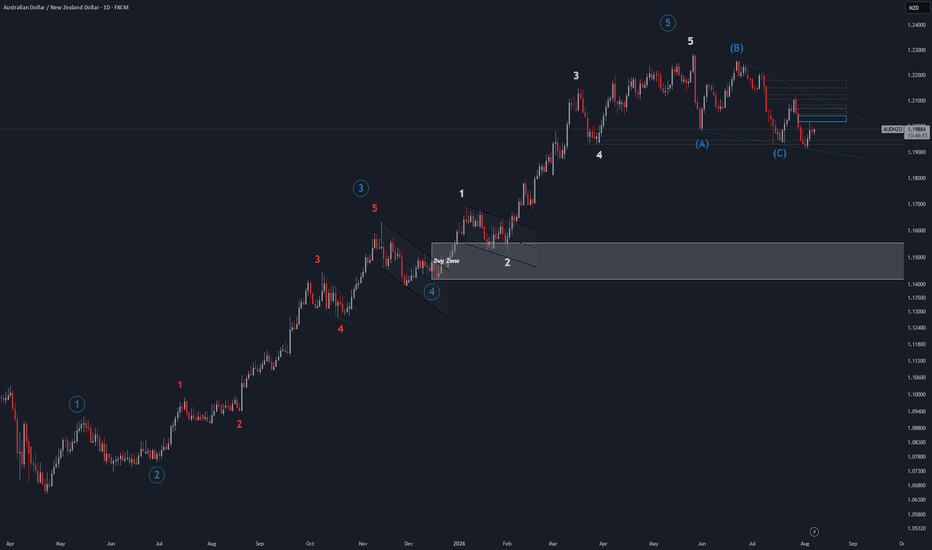
After completing a five-wave impulsive structure, the market appears to have entered a corrective phase. At this stage, I interpret the correction as an **ABC pattern**, with Wave C reacting from a key support area near the lower boundary of the descending channel. This suggests that bearish momentum may be weakening.
My primary scenario is that the **ABC correction is nearing completion**. A confirmed breakout above the descending trendline and the highlighted resistance zone would increase the probability of a new bullish impulse. In that case, the previous swing high would become the first target, with the potential for a continuation toward new highs.
An alternative scenario is that the correction is **not yet complete** and could evolve into a more complex corrective structure, such as a **Triangle (ABCDE)** or a **Double Three**. If this scenario unfolds, the market may form one more corrective leg before the larger uptrend resumes.
### Bullish Scenario
* Price holds above the current support.
* A breakout above the descending channel is confirmed.
* Price closes above the highlighted resistance zone, signaling renewed bullish momentum.
### Bearish Scenario
* Price fails to break the resistance.
* Wave C low is broken.
* The correction extends toward lower support levels.
**Conclusion:**
As long as the low of **Wave C** remains intact, I maintain a **moderately bullish bias**. However, confirmation will only come after a decisive breakout above the descending channel and the key resistance zone.
> **Disclaimer:** This analysis reflects my personal view based on Elliott Wave principles and is intended for educational purposes only. It should not be considered financial or investment advice. Always apply proper risk management.