AUD/USD Weekly | Two Valid Elliott Wave Scenarios
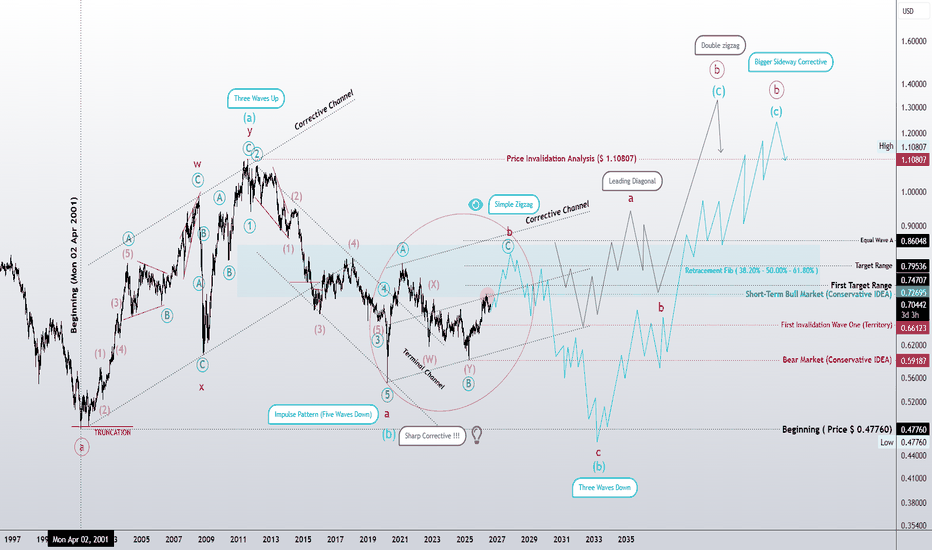
AUD/USD Weekly Chart | Elliott Wave Principle
The weekly structure continues to support two valid scenarios for the larger-degree Wave (B). Until the market provides additional evidence, both scenarios remain valid under the rules and guidelines of the Elliott Wave Principle.
Since this chart represents the relative value of the Australian Dollar against the U.S. Dollar, prolonged one-directional trends are generally less common than in many other markets. Monetary policy, interest rates, inflation, capital flows, and broader macroeconomic conditions from both economies often contribute to the development of complex and time-consuming corrective structures.
🔹 Aggressive Idea (Turquoise) | Primary Scenario
The primary view assumes that the market is developing a larger-degree sideways correction.
At this stage, the main focus is the red-circled area. The initial expectation is for a three-wave corrective structure, most likely a Zigzag. However, as the structure evolves, the possibility of a more complex corrective pattern cannot be ruled out.
For now, the objective is simply to observe the development of this three-wave correction before drawing further conclusions about the larger structure.
🔹 Conservative Idea (Gray)
The conservative scenario gains strength only if the expected move inside the red-circled area develops into a five-wave structure rather than remaining corrective.
If those five waves unfold as a Leading Diagonal, they may represent Wave (A) of a Zigzag. That would then be expected to be followed by a corrective Wave (B) and finally Wave (C) to complete the Zigzag.
Should this sequence unfold, the probability of a larger-degree Double Zigzag increases significantly, with Wave (Y) potentially developing in a manner similar to Wave (W).
📌 The key distinction between the two structures is that in Wave (W), Wave (C) completed as an Ending Diagonal. In this scenario, however, the expectation is for Wave (A) to begin as a Leading Diagonal, followed by a Wave (B) correction before Wave (C) completes the Zigzag.
🎯 Current Focus
At this stage, the red-circled area is the most important part of the analysis.
If the market produces only a three-wave correction, the aggressive scenario remains the preferred outlook.
However, if that movement evolves into a five-wave Leading Diagonal, the conservative scenario will gain considerably more confidence.
For now, the focus remains on identifying at least a three-wave corrective structure, as its quality and internal characteristics should provide valuable insight into the dominant scenario and the larger wave degree.
The objective of Elliott Wave Principle is not to predict the future, but to interpret market structure through objective rules and guidelines. Each new wave reveals another piece of the puzzle, and every scenario should evolve as the market structure unfolds.
✍️ Mr. Nobody
🎧 Patterns whisper. I listen.
Australian Dollar / U.S. Dollar
3 days ago
AUD/USD Monthly Chart | Elliott Wave Principle