Alibaba Group Wave Analysis – 4 August 2026
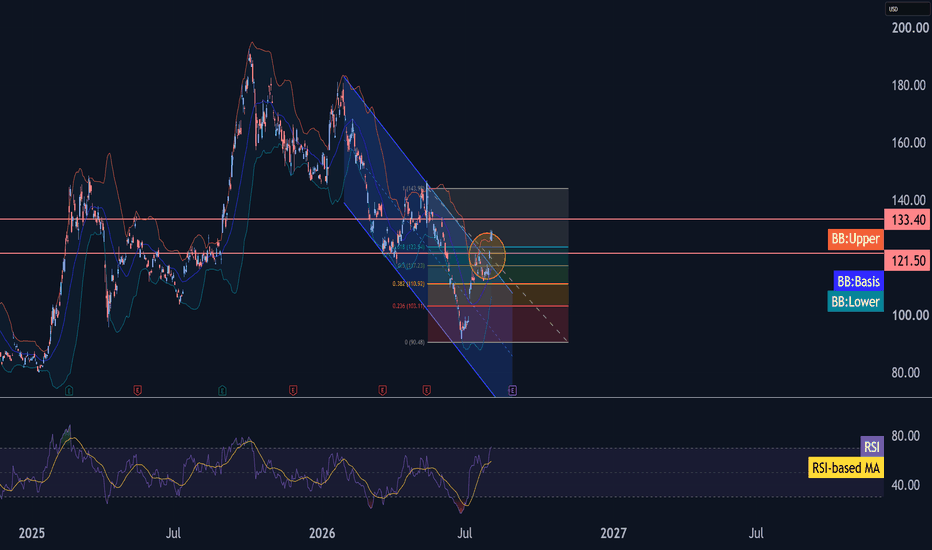
– Alibaba Group broke resistance zone
– Likely to rise to resistance level 133.40
Alibaba Group recently broke resistance zone located at the intersection of the resistance level 121.50 (top of earlier wave (A)), resistance trendline of the daily down channel from January and the 50% Fibonacci correction of the downward impulse from May.
The breakout of the resistance level 121.50 accelerated the active short-term impulse wave i – that belongs to the impulse wave (C) from the end of July.
Alibaba Group can be expected to rise further to the next resistance level 133.40 – target for the completion of the active short-term impulse wave i.