PEPEUSDT at a Critical Resistance – Breakout or Major Rejection?
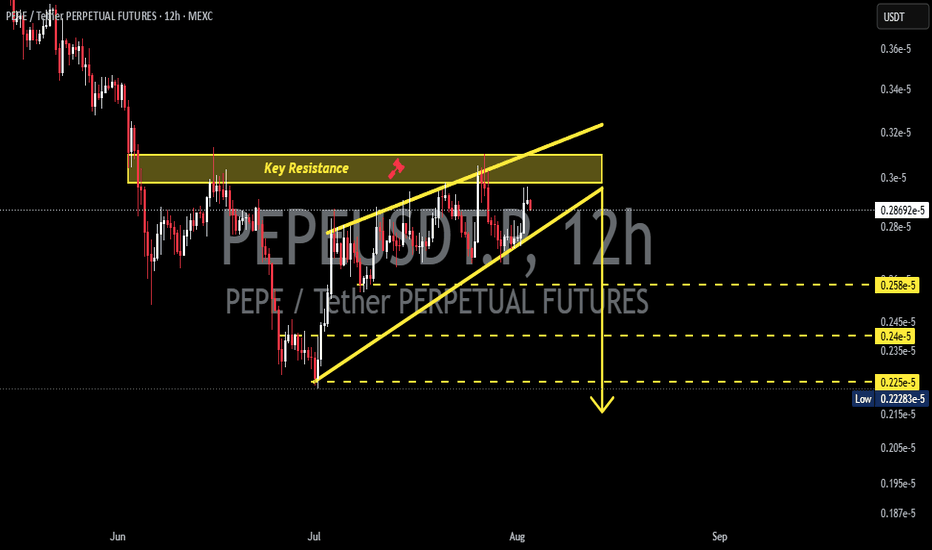
📊 Technical Analysis
💵 Coin:
 PEPE
#PEPE
PEPE
#PEPE
⏳ Time Frame: 12H
📈 Pattern: Ascending Triangle + Key Resistance Retest
🎯 Market Structure: Neutral to Bearish (Awaiting Confirmation)
---
🔍 Pattern Analysis
📐 Ascending Triangle
The chart is forming an Ascending Triangle, characterized by:
📈 A rising trendline connecting higher lows, indicating buyers are gradually building momentum.
🚧 A strong horizontal resistance zone (Key Resistance) that has rejected price multiple times.
⚠️ Price is now approaching a decisive area where the next major move is likely to begin.
An Ascending Triangle is generally considered a bullish continuation pattern, but confirmation is only valid after a strong breakout accompanied by increased trading volume.
---
🟢 Bullish Scenario (40%)
✅ Buyers successfully break above the Key Resistance and secure a strong 12H candle close above it.
📌 Bullish Confirmation:
📈 A clean breakout above the resistance zone.
📊 Rising trading volume supports the breakout.
🔄 Previous resistance turns into new support after a successful retest.
🎯 Potential Outcome:
🚀 Bullish momentum accelerates as breakout traders enter the market.
📈 Price has the potential to establish higher highs and continue the upward trend.
💰 A sustained breakout could trigger the next bullish expansion.
---
🔴 Bearish Scenario (60%)
⚠️ Price gets rejected once again at the resistance zone and fails to break higher.
📌 Bearish Confirmation:
❌ Multiple failed breakout attempts.
📉 Breakdown below the ascending trendline support.
🔻 Increasing selling pressure with bearish momentum.
🎯 Potential Downside Targets:
🟡 First Support: 0.258e-5
🟡 Second Support: 0.246e-5
🟡 Major Support: 0.225e-5
A breakdown below the ascending trendline would invalidate the bullish structure and could trigger a stronger correction toward the highlighted support levels.
---
📌 Key Levels to Watch
🚧 Key Resistance Zone
This is the most critical level on the chart.
A confirmed breakout is required before expecting a sustained bullish continuation.
🛡️ Ascending Trendline Support
As long as price remains above this trendline, buyers still have an opportunity to regain control.
Losing this support would significantly strengthen the bearish outlook.
📊 Volume Matters
A breakout without strong volume carries a high risk of becoming a bull trap.
Increasing volume is essential to confirm either a bullish breakout or a bearish breakdown.
---
📈 Conclusion
⚖️ PEPE is currently trading at a major decision point.
🟢 A confirmed breakout above the Key Resistance could initiate a fresh bullish rally and attract additional buying momentum.
🔴 However, another rejection followed by a break below the ascending trendline could lead to a deeper correction toward the marked support zones.
⏳ Patience is key—wait for confirmation before anticipating the next significant move.
---
#PEPE #PEPEUSDT #Crypto #CryptoTrading #TechnicalAnalysis #TradingView #Altcoins #AscendingTriangle #Breakout #Bullish #Bearish #Support #Resistance #PriceAction #CryptoSignals