ROP: Excellent Entry Zone, Strong Fundamentals
 ROP
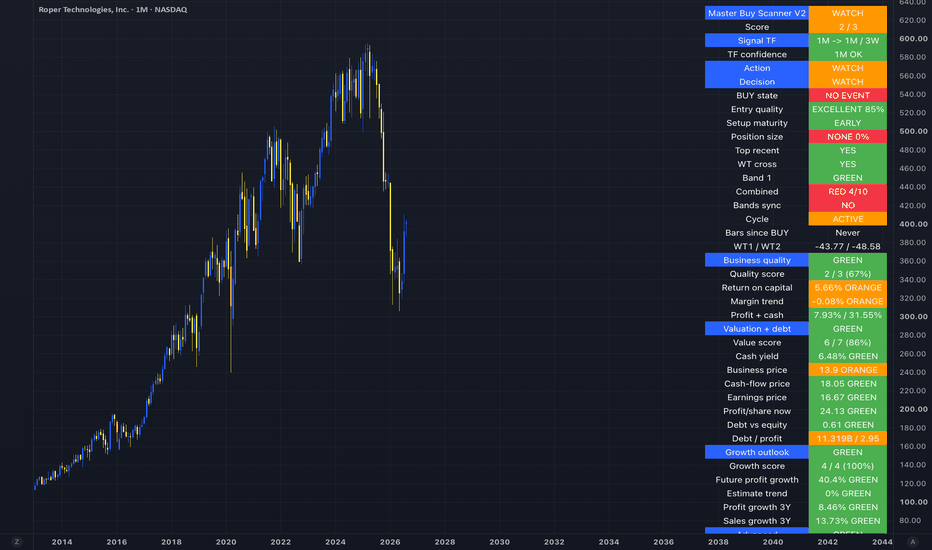
has fallen from nearly $600 to the low-$300s before rebounding toward $400. The correction has been severe for a company with one of the market’s strongest long-term capital-allocation models.
ROP
has fallen from nearly $600 to the low-$300s before rebounding toward $400. The correction has been severe for a company with one of the market’s strongest long-term capital-allocation models.
The Master Buy Scanner V2 now sees an excellent potential entry zone, but the monthly setup is not complete.
Current verdict: WATCH — not BUY yet.
Master Buy Scanner V2 — Monthly
Score: 2/3
Signal timeframe: 1M → 1M / 3W
Timeframe confidence: 1M OK
Action: WATCH
Decision: WATCH
BUY state: NO EVENT
Entry quality: EXCELLENT — 85%
Setup maturity: EARLY
Position size: NONE — 0%
Top recent: YES
WT cross: YES
Band 1: GREEN
Combined: RED 4/10
Bands synchronized: NO
Cycle: ACTIVE
Bars since BUY: Never
WT1 / WT2: -43.77 / -48.58
This is an interesting combination.
Momentum has reached the lower accumulation area and produced a bullish WT cross. Band 1 is already green and the broader cycle remains active.
But the Combined signal remains RED at only 4/10, and the bands are not yet synchronized.
That missing confirmation explains why the scanner assigns an 85% entry-quality score while still recommending 0% position size.
In other words: the price is becoming attractive before the technical reversal is fully confirmed.
Fundamentals remain strong
Roper reported another solid quarter in Q2 2026:
Revenue: $2.11B, +9%
Organic growth: +5%
Adjusted EPS: $5.38, +10%
Operating cash flow: $469M, +16%
Adjusted free cash flow: $447M, +11%
Management also increased its 2026 guidance, now expecting adjusted EPS of $22.15–$22.30 and approximately 6% organic revenue growth.
This matters because ROP's decline is not occurring alongside a fundamental collapse.
The company is still growing revenue, earnings and free cash flow.
Why Roper is unusual
Roper is essentially a portfolio of highly specialized vertical software and technology businesses operating in niche markets.
Its strategy is straightforward:
Acquire mission-critical businesses → maintain decentralized operations → generate recurring cash flow → redeploy that cash into additional acquisitions.
This model has allowed Roper to compound free cash flow and shareholder value over long periods.
Recurring and reoccurring software revenue already represented roughly $1.43B of Q1 2026 revenue, reinforcing the resilience of the portfolio.
The company is also introducing AI products across its portfolio. Management argues that its vertical businesses benefit from proprietary datasets and deep workflow knowledge, potentially giving them an advantage over generic AI solutions.
Capital allocation is another catalyst
Roper has become unusually aggressive with buybacks following the share-price decline.
During Q2 alone, it repurchased:
3.6 million shares for $1.2 billion.
Across the previous three quarters, the company had repurchased more than 8% of its outstanding shares, taking the share count back toward 2013 levels.
That is meaningful.
If management believes acquisitions are less attractive than its own stock at current prices, buying back 8%+ of the company can materially increase future free cash flow per share.
Roper also continues to maintain significant capacity for future acquisitions.
Scanner fundamentals
Business quality remains positive, although not perfect:
Quality score: 2/3
Return on capital: 5.66% — ORANGE
Margin trend: -0.08% — ORANGE
Cash-generation measure: 31.55%
The weaker return-on-capital reading partly reflects Roper's acquisition-heavy model. Large amounts of goodwill and acquired intangible assets naturally reduce conventional return metrics.
Cash generation is arguably more important for evaluating this particular business model.
Valuation has become much more interesting
The scanner gives ROP a strong 6/7 valuation score:
Cash yield: 6.48%
Business-price multiple: 13.9
Cash-flow multiple: 18.05
Earnings multiple: 16.67
Profit/share: 24.13
Debt-to-equity: 0.61
ROP historically commanded a premium because of its recurring revenue, acquisition model and consistent cash-flow compounding.
At around 16–18x scanner earnings/cash-flow measures, the valuation is considerably less demanding than investors have typically paid for the business.
Debt remains worth watching because acquisitions are an integral part of Roper's strategy, but the balance sheet does not currently appear to undermine the thesis.
Growth remains strong
The scanner gives Roper a maximum 4/4 growth score:
Future profit growth: 40.4%
Three-year profit growth: 8.46%
Three-year sales growth: 13.73%
Estimate trend: neutral
Roper also generated 12% revenue growth and 8% free-cash-flow growth in 2025, followed by continued growth through the first half of 2026.
So unlike many stocks appearing near the scanner's lower momentum boundary, ROP does not require a fundamental turnaround.
It mainly requires the market to regain confidence in the valuation.
Key technical levels
Immediate support: $380–$400
Secondary support: $350–$360
Major support: $315–$330
First resistance: $440–$450
Recovery confirmation: $480–$500
Major resistance: $540–$560
Previous highs: approximately $590–$600
The rebound from roughly $320 has been significant.
A successful hold above $380–$400 would be constructive, but the more important confirmation would be a recovery through $440–$450 while the Combined band turns green and synchronization appears.
That would materially improve the monthly setup.
My classification: HIGH-QUALITY WATCH
ROP currently has a lot going for it:
Excellent 85% entry quality
Bullish monthly WT cross
Strong recurring revenue
Growing earnings and free cash flow
Raised 2026 guidance
Aggressive share repurchases
6/7 valuation score
Maximum 4/4 growth score
Proven long-term capital allocation
But the technical signal is not finished:
2/3 scanner score
No BUY event
Combined band RED 4/10
Bands not synchronized
Position size 0%
This is exactly the type of stock I want on the watchlist before the BUY signal arrives.
Current verdict: WATCH — excellent setup developing, but wait for confirmation.
What would you do?
A) Start a small position around $400
B) Wait for the scanner to turn BUY
C) Wait for a breakout above $450
Master Buy Scanner V2:

This is not financial advice. Technical signals can fail, and even high-quality compounders can experience prolonged valuation compression.