Most Traders Misread These 3 Candlestick Patterns:
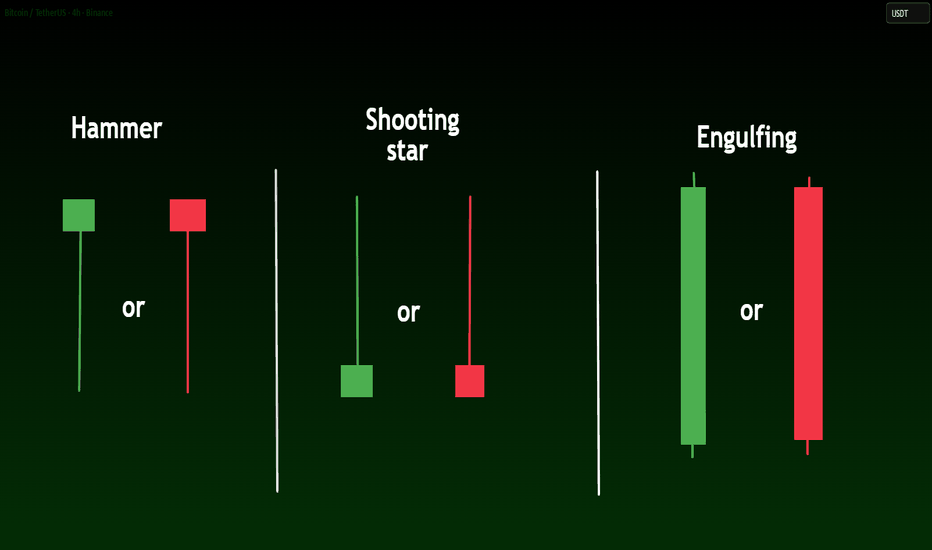
🔥 Three Candlestick Patterns Everyone Sees—but Most Traders Use Incorrectly
If you have only memorized the shapes of the Hammer, Shooting Star, and Engulfing patterns, you are missing the most important part:
The location of a candlestick pattern matters more than its shape.
A Hammer in the middle of a range is not automatically a buy signal. A Shooting Star without a prior uptrend is not automatically a sell signal.
Let’s learn how to trade these patterns properly.
━━━━━━━━━━━━━━
🔨 1. Hammer
A Hammer is a single-candle pattern with:
• A small real body near the top of the candle
• A lower wick preferably at least twice the size of the body
• Little or no upper wick
• Formation after a decline or near a valid support level
📖 What is the story behind it?
Sellers initially push the price sharply lower. Buyers then step in, absorb the selling pressure, and force the price to close near the candle’s high.
This rejection of lower prices may signal that bearish momentum is weakening.
✅ A Hammer becomes more meaningful when:
• It forms after a clear downtrend
• It appears at support, a previous low, or a demand zone
• Trading volume increases
• The next candle closes above the Hammer’s high
• Market structure begins to shift bullish
🎯 Conservative trade setup:
Entry: After a breakout or confirmation close above the Hammer’s high
Stop-loss: Slightly below the Hammer’s lowest point
Target: The next resistance level or at least a 1:2 risk-to-reward ratio
A Hammer can be green or red. Its color is less important than its location, structure, and confirmation.
⚠️ If the same candle appears after an uptrend, it is no longer a Hammer. It may be a Hanging Man.
━━━━━━━━━━━━━━
🌠 2. Shooting Star
A Shooting Star is another single-candle reversal pattern:
• A small real body near the bottom of the candle
• An upper wick preferably at least twice the size of the body
• Little or no lower wick
• Formation after an uptrend or near resistance
📖 What is the story behind it?
Buyers push the price significantly higher, but sellers regain control and force it to close near the candle’s low.
This shows rejection of higher prices and may indicate that bullish momentum is weakening.
✅ A Shooting Star becomes more meaningful when:
• It forms after a clear uptrend
• It appears at resistance, a previous high, or a supply zone
• It sweeps a previous high and closes back below it
• Trading volume increases
• The next candle closes below the Shooting Star’s low
🎯 Conservative trade setup:
Entry: After a breakout or confirmation close below the pattern’s low
Stop-loss: Slightly above the tip of the upper wick
Target: The next support level or at least a 1:2 risk-to-reward ratio
Important distinction:
If the same candle with a long upper wick appears after a downtrend, it is usually called an Inverted Hammer and may signal a potential bullish reversal.
After an uptrend = Shooting Star and possible bearish reversal
After a downtrend = Inverted Hammer and possible bullish reversal
The shape is similar, but the market context changes its meaning.
━━━━━━━━━━━━━━
🟢🔴 3. Engulfing Pattern
One important correction regarding the image:
An Engulfing pattern requires two candles. It is not simply one large green or red candle.
The real body of the second candle must engulf the real body of the first candle. The wicks do not necessarily need to be engulfed.
🟢 Bullish Engulfing
• Forms after a bearish move
• The first candle is usually bearish and relatively small
• The second candle is bullish and larger
• The second candle’s body completely covers the first candle’s body
This pattern suggests that control may be shifting from sellers to buyers.
Conservative entry: After price breaks above the pattern’s high
Stop-loss: Below the lowest point of the two candles
Target: The next resistance or a suitable risk-to-reward target
🔴 Bearish Engulfing
• Forms after a bullish move
• The first candle is usually bullish and relatively small
• The second candle is bearish and larger
• The second candle’s body completely covers the first candle’s body
This pattern suggests that control may be shifting from buyers to sellers.
Conservative entry: After price breaks below the pattern’s low
Stop-loss: Above the highest point of the two candles
Target: The next support or a suitable risk-to-reward target
The stronger the second candle and the more important the surrounding price level, the more meaningful the pattern may become—but no candlestick pattern guarantees a reversal.
━━━━━━━━━━━━━━
💎 The Formula for a High-Quality Setup
Candlestick alone = An early warning
Candlestick + key level + correct trend + volume + confirmation = A setup worth evaluating
Before entering a trade, ask these five questions:
Was there a clear trend before the pattern?
Did the pattern form at meaningful support or resistance?
Has the pattern candle fully closed?
Did the next candle confirm the expected direction?
Is there enough room for at least twice the potential reward compared with the risk?
If several answers are “no,” avoiding the trade may be the best decision.
━━━━━━━━━━━━━━
❌ Common Trading Mistakes
• Entering before the candle closes
• Trading patterns in the middle of a sideways range
• Focusing on color while ignoring location
• Confusing a Shooting Star with an Inverted Hammer
• Treating one large candle as an Engulfing pattern
• Entering without confirmation
• Placing the stop exactly at the tip of the wick
• Using excessive leverage because the pattern looks “perfect”
• Risking too much capital on a single setup
━━━━━━━━━━━━━━
📌 Final Takeaway
Candlestick patterns do not predict the future. They visualize the battle between buyers and sellers.
Your goal is not simply to find a beautiful candle shape. Your goal is to understand:
Who is gaining control?
Where is the shift happening?
What evidence confirms it?
Save this guide and use the five-question checklist before your next trade.
Which pattern has worked best for you: Hammer, Shooting Star, or Engulfing? Share your experience in the comments 👇