BTC $64,925.00 ▲ 0.57% ETH $1,913.51 ▲ 0.50% USDT $0.9994 ▲ 0.03% BNB $590.20 ▼ 0.48% XRP $1.03 ▼ 1.35% SOL $73.51 ▲ 0.17% DOGE $0.0694 ▲ 0.59% SHIB $0.00000464 ▼ 1.90% PEPE $0.00000282 ▲ 1.16% BTC $64,925.00 ▲ 0.57% ETH $1,913.51 ▲ 0.50% USDT $0.9994 ▲ 0.03% BNB $590.20 ▼ 0.48% XRP $1.03 ▼ 1.35% SOL $73.51 ▲ 0.17% DOGE $0.0694 ▲ 0.59% SHIB $0.00000464 ▼ 1.90% PEPE $0.00000282 ▲ 1.16%
İçerik Alanı728x90
Ethereum Piyasa

Silver (XAG)- The Setup That Could Lead to a New All Time High

Silver (XAG)- The Setup That Could Lead to a New All Time High

Silver OANDA:XAGUSD
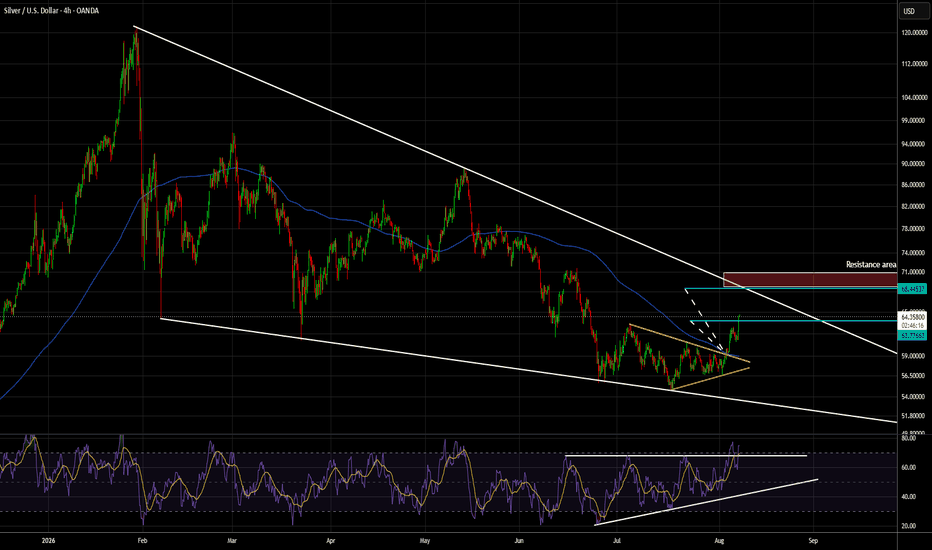
Using the 4H chart we see the price has formed a six-month descending wedge since late January, during which it experienced a significant 55% correction.

What stands out as a potential sign of bottoming is the basing price action forming a symmetrical triangle. After a prolonged decline, the price is stabilizing, suggesting that selling pressure is fading and a potential trend reversal is developing.

Zooming in the triangle:

Using the classic symmetrical triangle method to calculate the post-breakout targets, we can see that the price has already reached Target 1 at $63.78. The next target is $68.45, which is particularly interesting because it lines up almost perfectly with the upper trendline of the descending wedge. This creates an important confluence zone and could be a key test for the continuation of the bullish reversal.

Back to the 4H chart:
As mentioned, the triangle’s second target lines up almost perfectly with the “ceiling” of the wedge, creating a strong area of confluence. Another bullish signal is that the price has now reclaimed the 4H 200-period moving average, which it had remained below for more than two months.

Additionally, the RSI has broken above its own symmetrical triangle structure after consolidating for nearly two months. The longer a pattern takes to develop, the more significant the eventual breakout tends to be, as it reflects a longer period of momentum buildup before the next directional move.

Zooming out to the daily chart:
The entire structure is starting to resemble a bull flag pattern, where the strong impulsive move higher represents the flagpole, while the descending wedge that followed acts as the consolidation phase. A breakout above the upper boundary of the wedge would confirm the continuation pattern and could signal the next leg higher.

When analyzing silver, I also pay close attention to the gold-to-silver ratio $XAU/XAG, as it helps identify the relative strength between the two metals. By tracking whether the ratio is rising or falling, we can get a better understanding of whether gold or silver is likely to lead the next move in the precious metals market.

XAU/XAG Chart:
On the chart, the double top formation is clearly visible. Historically, this pattern often signals a potential reversal and is usually followed by a meaningful decline. My expectation is that the price could continue lower toward the trendline, which currently sits around 5% below current levels, before finding support and potentially reversing higher.

If this scenario plays out, it would suggest that the XAU/XAG ratio declines, meaning silver could outperform gold over the coming days or weeks.

Conclusion-

I remain bullish on both silver and gold, expecting another leg higher that could push both metals to new all-time highs. In the short to medium term, the gold/silver ratio suggests that silver has the potential to outperform gold in the next move.

The key area to watch for silver is the $68.5–$71 zone, which represents the upper boundary of the wedge structure. This area also aligns with the 200-day moving average, creating a strong resistance zone that could determine whether the bullish move continues or faces a pullback.


İlgili Haberler

Yorumlar (0)

Yorum yapmak için giriş yapın.

Henüz yorum yapılmamış. İlk yorumu siz yapın.

İçerik Alanı728x90