ETHUSDT
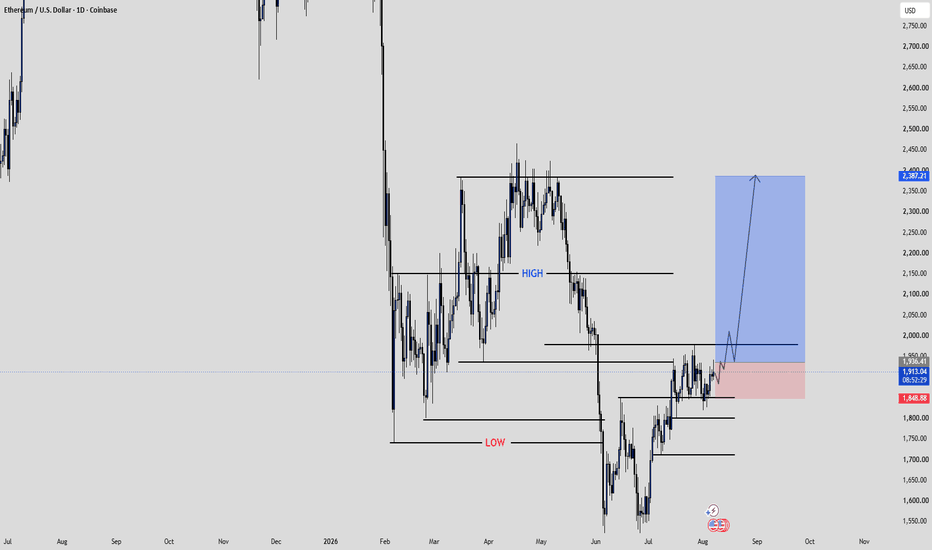
This is a TradingView daily (1D) chart of ETH/USD (Coinbase) with a market structure and swing-trading setup drawn on it.
Chart Breakdown
Timeframe: 1 Day (1D)
Asset: Ethereum (ETH/USD)
Current Price: Around $1,911
Bias Illustrated: Bullish continuation after accumulation.
What the markings mean
Major Swing High
The upper horizontal line around $2,370–2,390 marks the previous resistance where buyers were rejected.
This is the long-term target area.
Previous High
The line labeled HIGH (around $2,140) identifies an intermediate swing high.
It serves as an important market structure level.
Previous Low
The line labeled LOW (around $1,730) marks the significant swing low after the selloff.
Holding above this low keeps the bullish recovery intact.
Current Structure
ETH formed a sharp decline.
It then created a base around $1,550–1,700.
Price has recovered and is consolidating just below the $1,950–2,000 resistance.
Resistance Zone
The horizontal line near $2,000 is the nearest resistance.
A daily close above this level would indicate a bullish breakout.
Trade Idea Shown
The blue/red rectangle is a long-position risk-reward tool.
Entry: Around $1,900–1,930
Stop Loss: Around $1,850
Take Profit: Around $2,290–2,300
Risk-to-Reward: Approximately 1:4 to 1:5, which is a favorable setup.
Expected Price Path
The drawn arrow suggests:
Small pullback after entry.
Break above $2,000.
Retest of the breakout.
Strong continuation toward $2,350–2,400.
Overall Technical Bias
The chart reflects a bullish market structure because:
Higher lows are developing after the June bottom.
Price is consolidating beneath resistance rather than rejecting sharply.
The trade targets the previous supply zone while risking only a move below recent support.
The key confirmation is a daily close above $2,000. Failure to hold above roughly $1,850 would invalidate the bullish setup and increase the probability of another move toward the lower support around $1,750–1,700.