ETH/USD 45-Minute Chart Analysis
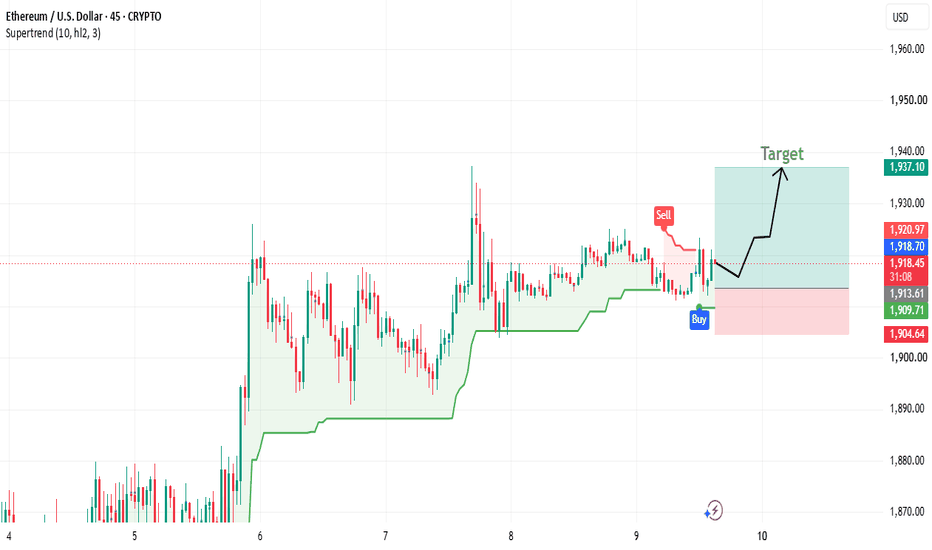
📊 Current Market Structure
Pair: Ethereum / U.S. Dollar (ETH/USD)
Timeframe: 45-minute
Current price: approximately $1,918.64
Price is consolidating around $1,915–$1,920 after a strong upward move from the $1,870–$1,900 area.
The green Supertrend line remains below price, currently around $1,909.71, indicating that the short-term trend is still bullish.
🟢 Buy Setup
The chart shows a BUY signal near the $1,909–$1,913 region. The subsequent price action has held above this area, supporting the bullish setup.
Key levels:
Entry/support zone: $1,909–$1,914
Current price: ~$1,918.64
First resistance: $1,920–$1,925
Upside target: $1,937.10
Major invalidation/stop area: below $1,904.64
📈 Bullish Scenario
If ETH maintains the $1,909–$1,914 support zone and breaks convincingly above $1,920–$1,925, the chart suggests continuation toward:
$1,930 → $1,937
The drawn projection also shows a brief pullback/consolidation before another move higher, which fits the current sideways price structure.
⚠️ Bearish Scenario
The bullish setup weakens if ETH loses the green Supertrend around $1,909.71.
A decisive break below $1,904.64 would invalidate the displayed long setup and could expose lower support around $1,900 and potentially $1,890.
🎯 Overall Bias
Bullish / Buy-on-Dips
The structure favors upside continuation as long as price remains above approximately $1,909–$1,910. The $1,937.10 target is reasonable from the chart, but ETH first needs to clear the $1,920–$1,925 resistance area.
Risk/reward: The displayed setup offers roughly $18–$27 of upside from the $1,909–$1,918 area versus about $5–$14 of downside toward the $1,904.64 invalidation, depending on entry.