XAUUSD Analysis | Triangle FMFR Setup
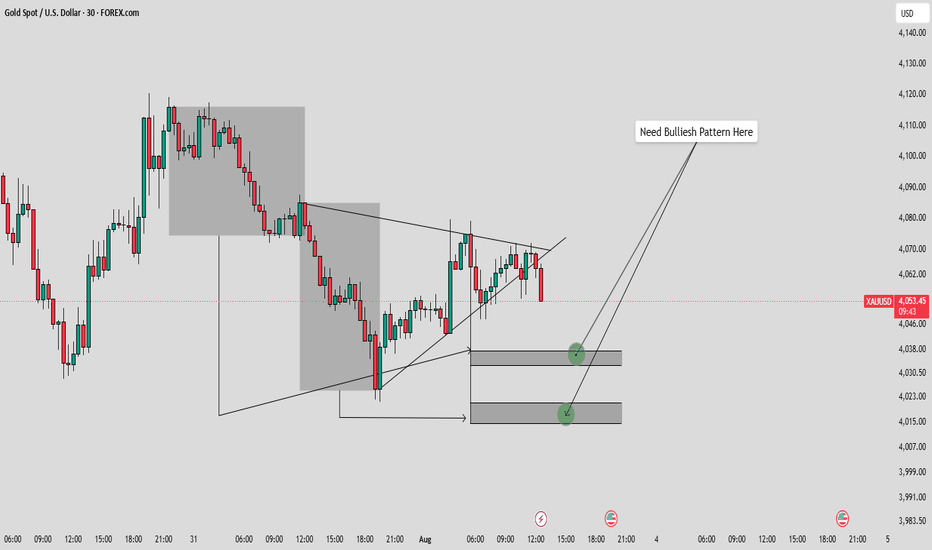
XAUUSD is currently presenting a market structure that aligns with one of my preferred trading concepts: the Triangle FMFR (First Move Fake Then Reversal) setup. After a strong impulsive move, price entered a period of compression and formed a symmetrical triangle, signaling that buyers and sellers were reaching equilibrium while liquidity accumulated on both sides of the pattern.
As expected, the market eventually broke below the triangle support, triggering a bearish expansion. While many traders view this as a continuation signal, I believe this initial breakdown could simply be the first move designed to collect liquidity before the market reveals its true direction.
Rather than chasing the bearish breakout, my focus is on the reaction inside the two highlighted demand zones, where I expect institutional buying interest may appear.
Triangle FMFR Concept
The Triangle FMFR strategy is based on the idea that markets often create a false breakout after a period of compression.
The sequence I am monitoring is:
Price compresses inside the triangle while liquidity builds.
The triangle breaks to the downside, attracting breakout sellers.
Sell-side liquidity is collected beneath the structure.
Price enters a key demand zone.
Buyers defend the level and create a bullish confirmation.
The market reverses and begins the next bullish expansion.
This approach allows me to avoid chasing the first breakout and instead focus on confirmation after liquidity has been taken.
Two Demand Zones – My Trading Plan
Instead of relying on a single support level, I have identified two demand zones that could generate the reversal.
Demand Zone 1 – Primary Area of Interest
The first demand zone is my initial reaction area.
If buyers step in here and produce a clear bullish reversal pattern, this could be enough to trigger the next bullish leg.
However, I will not buy simply because price touches the zone.
I need the market to confirm that demand is overcoming supply.
Demand Zone 2 – High-Probability Backup Zone
If sellers remain strong and price breaks below the first demand zone, my attention immediately shifts to the second demand zone.
This lower area represents a deeper discount level and could become the stronger accumulation zone if the market performs another liquidity sweep before reversing.
In many cases, institutions push price deeper into liquidity before initiating the actual move higher. For this reason, I remain patient if the first zone fails.
Bullish Confirmation Is Mandatory
Whether price reacts from the first or second demand zone, my trading decision remains exactly the same.
I will only consider long opportunities after seeing clear bullish confirmation.
The confirmation I want includes:
A strong bullish rejection candle.
A bullish engulfing candle or another reliable reversal pattern.
A Market Structure Shift (MSS) through a break above the most recent lower high.
Higher lows forming after the initial reaction.
Strong bullish momentum with convincing candle closes.
Without these confirmations, I will simply continue waiting.
Alternative Scenario
If both demand zones fail to hold and price closes decisively below the second zone, the Triangle FMFR idea becomes invalid.
That would indicate sellers remain in control, increasing the probability of further downside. In that case, I will stand aside and wait for the market to develop a new high-probability setup rather than forcing a trade.
Trading Plan
Bullish Scenario
Monitor Demand Zone 1 for a bullish reaction.
If no confirmation appears, shift focus to Demand Zone 2.
Enter only after a confirmed bullish pattern and Market Structure Shift.
Place the stop-loss below the confirmation swing low.
Target the broken triangle structure first, followed by previous resistance levels if momentum continues.
Bearish Scenario
If both demand zones fail, invalidate the bullish setup.
Wait for fresh bearish continuation opportunities after a retest of resistance.
Key Takeaway
This analysis is not about predicting where the market will reverse—it is about preparing for high-probability reactions.
The triangle has already produced its first bearish move, and now the market is approaching two carefully selected demand zones. My expectation is that price could reverse from either the first demand zone or the second demand zone, but I will only participate if the market prints a clear bullish confirmation pattern.
Patience is the edge. The demand zone identifies where I want to trade, but the bullish confirmation tells me when to trade. Waiting for confirmation transforms a good idea into a high-probability setup.