XAUUSD 4H | Smart Money Structure, Liquidity and Demand Analysis
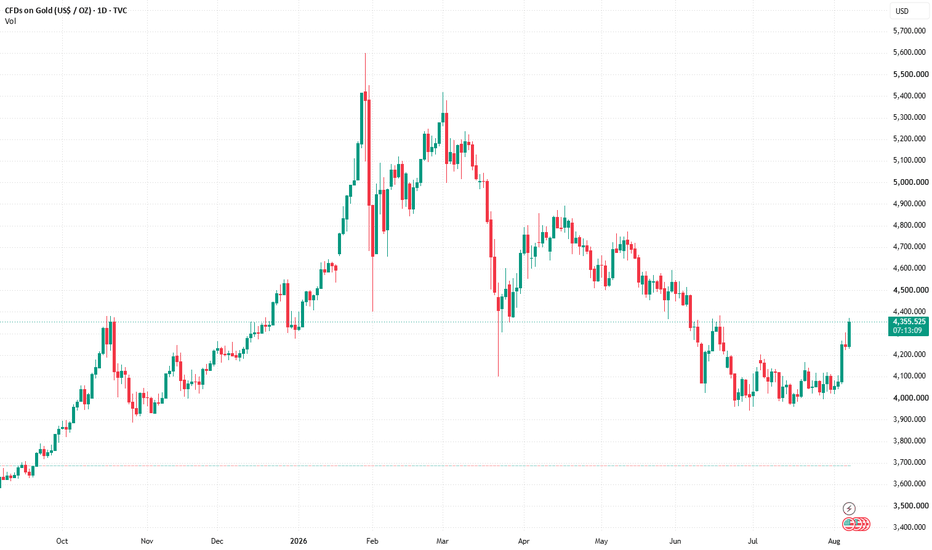
1. Early Bearish Pressure
The opening candles reflected clear downside momentum from elevated price levels. Wide bearish bodies and repeated lower closes showed that sellers remained dominant while price continued forming lower lows.
Reason:
The move began after rejection from a premium area, which encouraged further selling toward liquidity resting below the market.
2. Sell-Side Liquidity Sweep
Price then traded beneath earlier lows and printed noticeable rejection wicks. This suggested that liquidity under those lows was taken before stronger buying interest appeared.
Reason:
In smart money concepts, weak lows can attract liquidity, and sweeping those levels may happen before a change in direction.
3. Bullish Response From Demand
Once price reached the lower demand zone, bullish candles started to strengthen. Buyers absorbed part of the selling pressure and pushed the market higher from the discount area.
Reason:
The demand zone acted as a reaction area where buying activity increased and helped slow the previous bearish move.
4. CHoCH Development
Price later moved above nearby minor highs, creating a Change of Character, or CHoCH. This suggested that short-term structure was beginning to shift in favor of buyers.
Reason:
After defending demand, buyers gained enough momentum to break local resistance and weaken the previous bearish sequence.
5. Sideways Consolidation
After the recovery, price entered a more balanced range. Candle bodies became smaller and movement stayed contained between nearby support and resistance levels.
Reason:
This type of pause can represent liquidity building on both sides while the market waits for a stronger directional move.
6. Equal Highs Formation
Several candles reacted around the same upper level without producing a decisive breakout. This created equal highs and left visible liquidity above the range.
Reason:
Repeated highs can attract buy-side liquidity, making the area above them a potential objective for a future expansion.
7. Bullish Range Break
The market eventually produced stronger bullish candles that pushed through the upper boundary of the consolidation and cleared previous resistance.
Reason:
The breakout showed stronger buyer participation and suggested that momentum had temporarily shifted further to the upside.
8. Ongoing Bullish Expansion
The latest candles continue to show strong upward pressure as price moves toward the weak high zone. Larger bullish bodies indicate that demand remains active.
Reason:
Buyers appear to be reaching for liquidity positioned above earlier highs while price approaches higher resistance.
9. Possible Reaction From Resistance
As price moves into the upper supply area, candles may begin to lose strength, form smaller bodies, or leave rejection wicks.
Reason:
Higher supply can contain resting sell orders, which may slow the bullish move and trigger a temporary correction.
10. Potential Pullback Scenario
If the upper area rejects price, bearish candles could move back toward the 4075–4065 demand zone for a possible retest.
Reason:
After a breakout, price often revisits a previously broken or defended area before deciding whether to continue in the same direction.