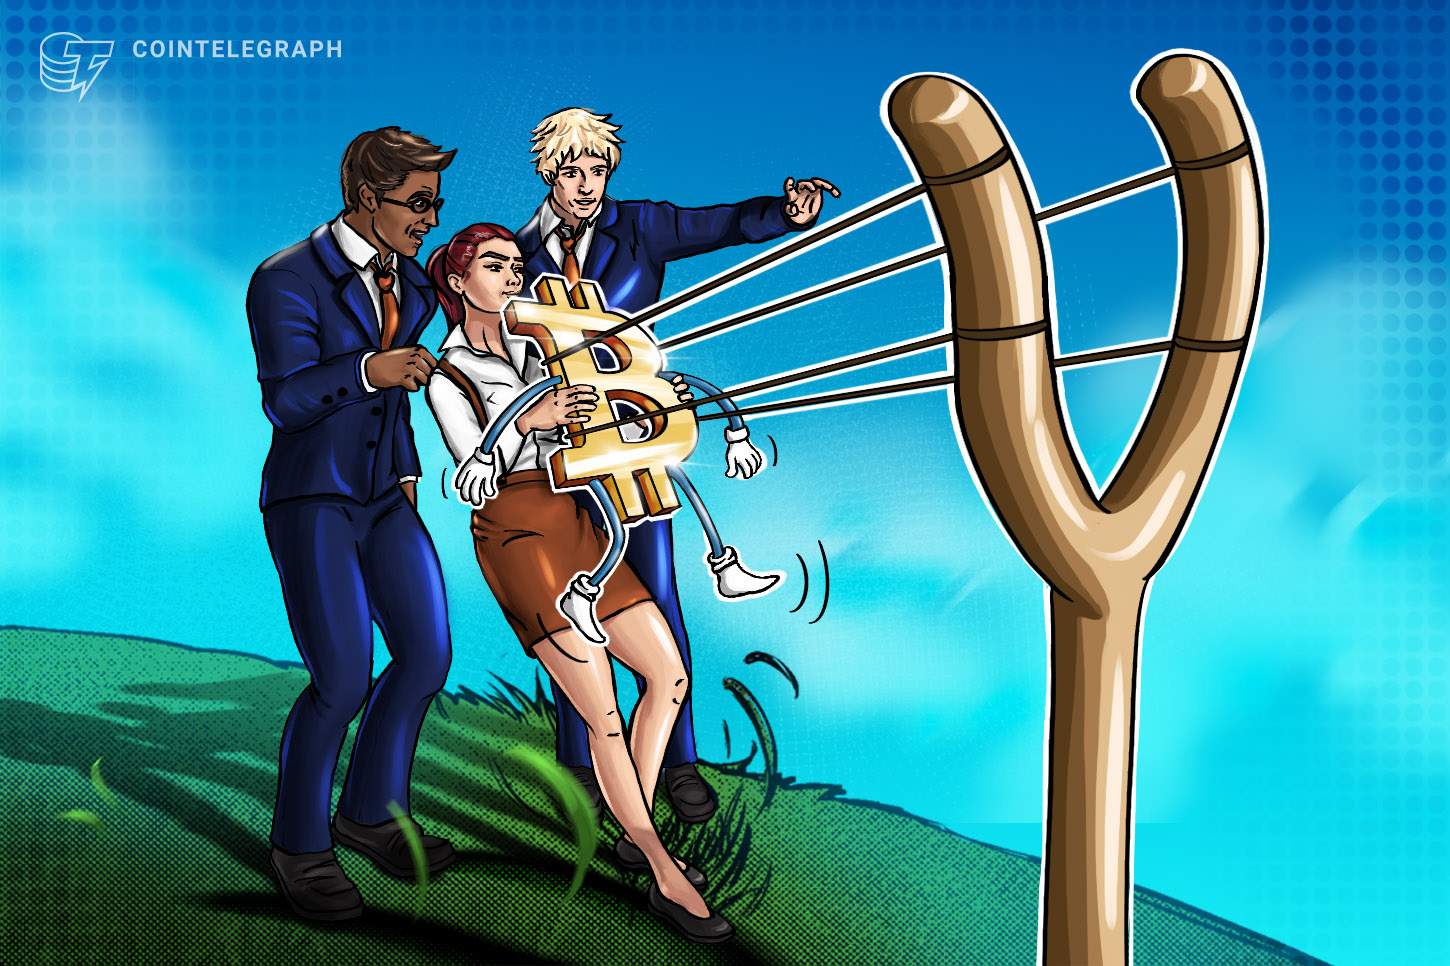
Why price takes the stops, then reverses
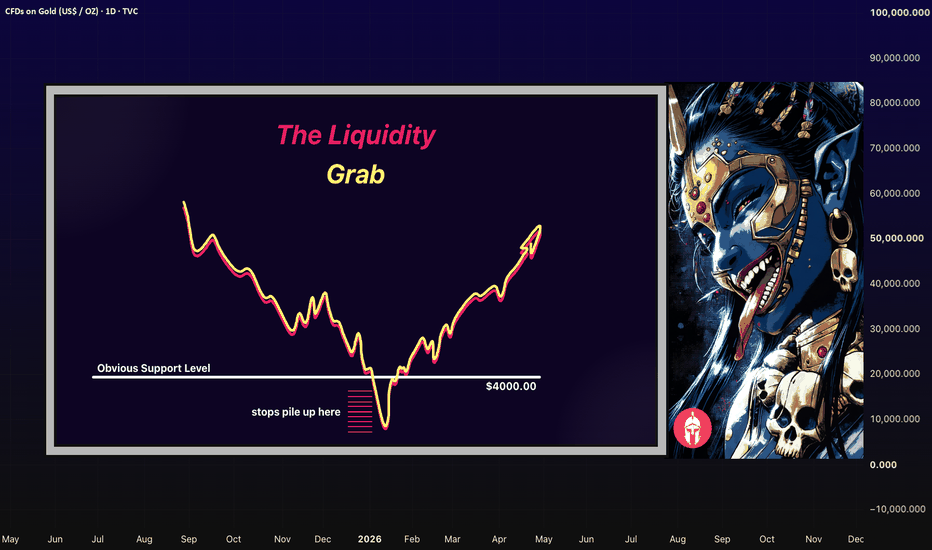
Price dips just under an obvious low, clips a pile of stops, then turns and runs the other way without the traders it just knocked out. If that has happened to you, it can feel personal. It isn't. A stop is the order that closes your trade to cap a loss, and there is a plain reason so many of them end up parked in the exact spot price loves to reach for.
That reason has a name, and once you get it, a lot of those infuriating exits start to make sense.
🤷 What liquidity actually means
Liquidity is just how many orders are resting at a given price, waiting to be filled. Thick liquidity means a lot of buy and sell orders stacked there. Thin liquidity means almost none.
It matters because every trade needs someone on the other side. A small trader can get filled almost anywhere. A large order can't, so it gets pulled toward the prices where a lot of resting orders sit, because that's the only place there's enough on the other side to fill it. Size goes where the fuel is.
🎯 Why stops pile up in the obvious spots
We all read the same chart. We all see the same clean swing low, the same round number, the same obvious line under price. And most traders are taught to hide their stop just past it. So when thousands of people set theirs a few ticks under the same visible low, all those stops stack into one dense pool in nearly the same place. The chart looks like support. Underneath, it's a pile of fuel sitting exactly where everyone can see it.
🪝 The run, then the snap back
So price drifts toward that low and pokes a little under it. Every one of those stops fires at once. A stop on a long position is a sell order, so they all trigger together and shove price a touch lower for a moment.
Then, more often than you'd think, the move is finished, because the goal was only ever to reach the orders parked below. Once they are filled, the pressure is gone and price snaps back above the level, leaving everyone who got knocked out to watch it run without them. The market did not single them out. They hid in the same obvious place, and price simply went where the orders were.
🛠️ How to trade on the right side of it
You don't need to catch every one of these. You need to stop being the fuel. Give your stop a little room, or set it somewhere the crowd isn't, past the noise instead of right on the line everyone can see. When price stabs through an obvious level and immediately climbs back above it, treat that as a possible liquidity grab rather than a real breakout, and sometimes the cleaner trade is the other direction. When a level breaks for real, it tends to keep going and not come straight back. The few candles right after the poke are what tell you which one you are looking at.
A spike beyond a level is a question. What price does in the next few candles is the answer.
Have you had the classic one, stopped out on the spike and then watched it run without you? Where do you put your stop now to stay out of the crowd?