USTEC NASDAQ
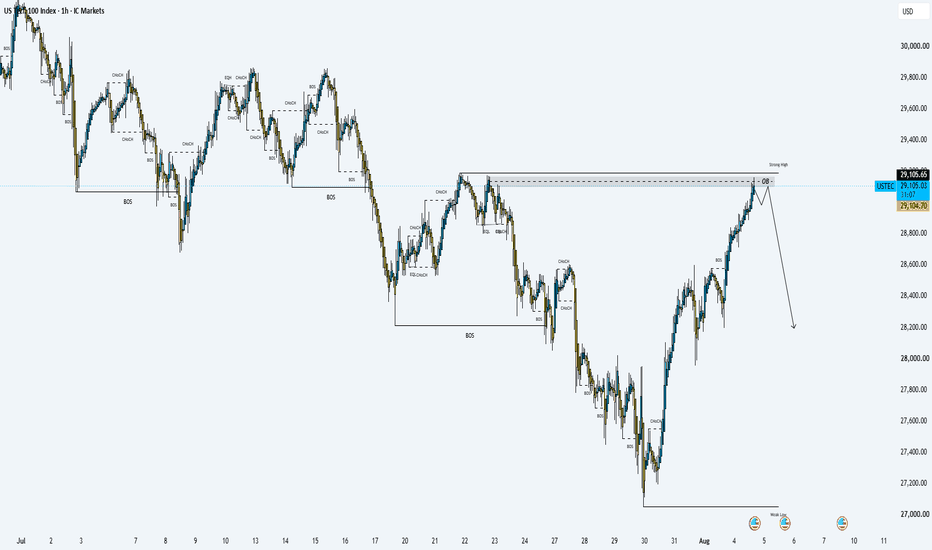
Based on the 1-hour chart (US100 / Nasdaq), price has just tapped into a key Bearish Order Block (OB) and resistance zone near 29,094 – 29,103, aligning with a previous Strong High.
Market Analysis & Scenarios
Primary Bearish Scenario (SMC Setup):
Price is currently testing the grey supply/OB zone around 29,094.68.
A bearish reaction or rejection from this level (confirmed by a CHoCH on lower timeframes like 5m or 15m) would validate the projection shown on your chart, targeting the lower liquidity pools down toward 28,200.
Invalidation Criteria:
A sustained 1-hour candle close above 29,103.80 invalidates the bearish outlook.
Clearing this Strong High flips the bias bullish, opening the path toward upper liquidity targets at 29,400 and 29,600.
Execution Strategy
Confirmation Entry: Avoid entering directly on touch. Wait for a lower-timeframe Change of Character (LTF CHoCH) to confirm institutional selling before taking a short position.
Risk Management: Place the Stop Loss (SL) just above the high of the Order Block (29,103.80+) to maintain a tight risk-to-reward ratio.