USD/JPY 15M: Bearish BOS Retest Meets a Liquidity Reclaim
Market Thesis:
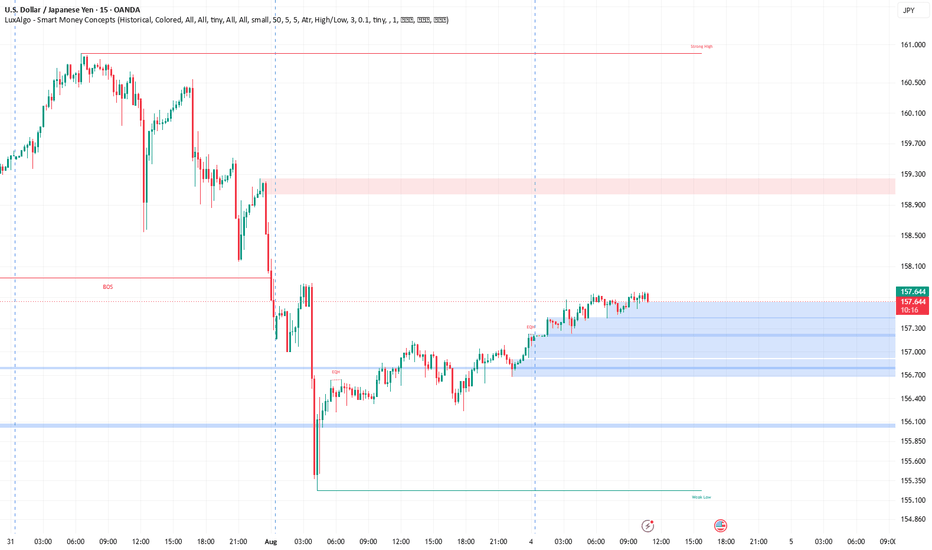
USD/JPY remains bearish in its broader 15-minute order flow, with the LuxAlgo Strong High at 160.96 and Weak Low at 155.13 indicating that downside liquidity remains vulnerable.
The immediate recovery above local equal highs shows short-term bullish delivery, but price is now approaching the critical 157.96 bearish BOS level. Acceptance above that level is required before the recovery can develop into a meaningful structural reversal.
Visible Confluences — 15-Minute Chart:
Current chart price: 157.703.
Bearish BOS: approximately 157.96 — the nearest structural decision point.
Reclaimed EQH liquidity: approximately 157.44; price is currently holding above this local liquidity level.
Blue highlighted reaction zone: approximately 156.65–157.45.
Internal references within that zone are visible near 157.20 and 156.80.
Major horizontal support: approximately 156.00.
LuxAlgo Weak Low: approximately 155.13, representing the principal downside liquidity objective.
Overhead red reaction zones: approximately 159.09–159.29 and 159.38–159.56.
LuxAlgo Strong High: approximately 160.96, defining the protected external high.
No Order Block or FVG is explicitly identified on the chart; the shaded regions are therefore treated strictly as visible reaction zones rather than assumed OBs or imbalances.
Trade Scenarios:
Setup 1: Sell the Bearish BOS Retest
Direction: Sell
Entry Zone: 157.92–158.05
Confirmation: A sweep above 157.96 followed by a 1-minute or 5-minute bearish CHoCH, decisive rejection candle, or momentum close back below 157.90.
Stop Loss: 158.22
TP1: 157.45
TP2: 156.80
TP3: 156.00
Logic: The 157.96 level is broken support and the nearest bearish structural pivot. Failure to achieve acceptance above it would favor continuation toward the blue zone and lower liquidity.
Setup 2: Buy the Blue-Zone Pullback
Direction: Buy — countertrend until 157.96 is reclaimed
Entry Zone: 156.75–157.20
Confirmation: A liquidity sweep inside the zone followed by a lower-timeframe bullish CHoCH or an impulsive candle closing back above 157.20.
Stop Loss: 156.55
TP1: 157.70
TP2: 157.96
TP3: 159.09
Logic: The highlighted zone supported the latest bullish expansion. Long exposure is justified only after buyers demonstrate renewed displacement; blind limit execution is lower probability.
Setup 3: Sell the Overhead Reaction Zones
Direction: Sell
Primary Entry Zone: 159.09–159.29
Secondary Entry Zone: 159.38–159.56
Confirmation: A lower-timeframe buy-side liquidity sweep, bearish CHoCH, and momentum rejection from either visible red zone.
Stop Loss: 159.70
TP1: 157.96
TP2: 157.20
TP3: 156.00
Logic: These are the clearest visible premium reaction areas below the protected 160.96 Strong High. A rally into them would offer superior risk-to-reward for bearish continuation.
Refinement Tip:
For the best risk-to-reward, monitor the identified 15-minute zones on the 1-minute and 5-minute charts. Require a liquidity sweep, LTF CHoCH, or decisive momentum candle before execution. A sustained 15-minute close above 157.96 weakens the immediate bearish setup; acceptance above 159.56 invalidates the nearby supply thesis.
⚠️ Disclaimer:
Trading financial markets involves significant risk, and no technical framework can guarantee an outcome. This analysis reflects the visible 15-minute structure and probability-based scenarios at the time of the screenshot. It is provided strictly for educational and analytical purposes; position sizing, execution discipline, and independent risk assessment remain essential.