

SMCI 4H — The Less Exciting Scenario Matters Too
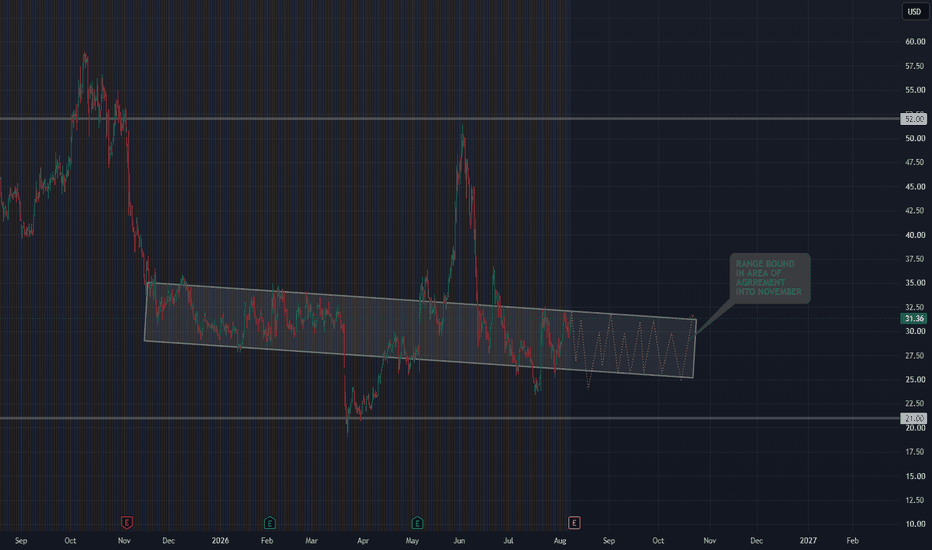
After laying out the daily chart, I wanted to zoom into the 4-hour because this timeframe shows something the daily view can hide:
SMCI could simply stay boring for a while.
The daily chart has a constructive bullish scenario if price eventually works its way back toward the larger declining trendline and the $52 area. But that is only one possibility.
On the 4-hour, price is still sitting inside a well-defined Area of Agreement, and there is nothing here that says it has to break out immediately.
A perfectly reasonable scenario is continued rotation inside roughly the mid-$20s to low-$30s portion of this structure for weeks.
That would not invalidate the larger bullish possibility. It would simply mean price is still building structure before making a more meaningful decision.
For me, that distinction matters.
I’m not looking at this chart and thinking, “SMCI is about to move.”
I’m looking at it and thinking:
If it remains inside this area, I expect range-bound behavior. If the structure begins to change, then I start paying closer attention.
The daily chart gives me the larger roadmap.
The 4-hour chart reminds me that sometimes the market takes the scenic route.
