Protected High, Vulnerable Low — XAUUSD Liquidity Map Is Clear
Market Thesis
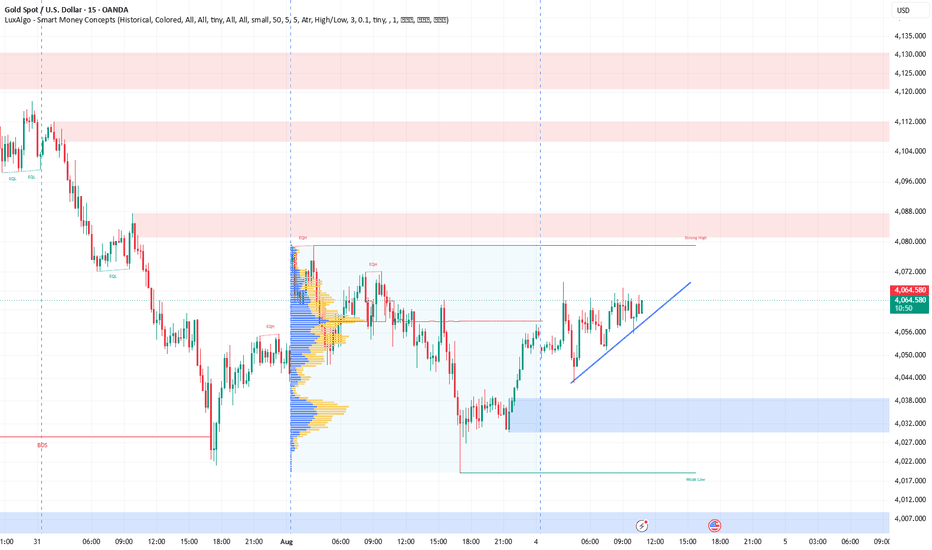
XAUUSD is trading near 4,062.500 on the 15-minute chart. The visible LuxAlgo structure retains a bearish external bias: the Strong High at approximately 4,079.500 remains protected, while the Weak Low at approximately 4,019.000 represents vulnerable sell-side liquidity.
The recovery from the nearby demand zone is constructive internally, but below 4,088.000, it remains a retracement into overhead supply—not a confirmed bullish reversal.
Visible Confluences — 15-Minute Chart
Bearish BOS: Approximately 4,028.500, confirming the prior downside structural break.
Strong High / protected liquidity: Approximately 4,079.500.
Weak Low / downside liquidity objective: Approximately 4,019.000.
Visible EQH liquidity: Concentrated around 4,071.000 and 4,080.000–4,081.000.
Immediate bearish supply zone: 4,082.000–4,088.000.
Higher bearish supply zones: 4,107.000–4,112.000 and 4,121.000–4,130.000.
Immediate bullish demand zone: 4,030.000–4,039.000, with a visible reaction already delivered.
Major lower demand zone: 3,996.000–4,009.000.
No clearly plotted FVG box or label is visible, so no FVG is included in the thesis.
Trade Scenarios
Setup 1 — Primary Sell: Strong-High Liquidity Sweep
Direction: Sell
Entry zone: 4,079.500–4,087.500
Required confirmation: Price sweeps the Strong High or enters the red supply zone, followed by a 1-minute or 5-minute bearish CHoCH, displacement candle, and rejection back below 4,078.000.
Stop Loss: 4,090.500
TP1: 4,070.000
TP2: 4,054.500
TP3: 4,035.000
This is the preferred institutional scenario while the protected high remains intact.
Setup 2 — Tactical Buy: Demand-Zone Reaction
Direction: Buy
Entry zone: 4,030.000–4,038.500
Required confirmation: A liquidity probe into demand followed by a bullish LTF CHoCH and a momentum candle closing above 4,041.000.
Stop Loss: 4,026.500
TP1: 4,047.000
TP2: 4,062.500
TP3: 4,078.000
This is a countertrend execution. Profits should be managed aggressively as price approaches the protected high and overhead supply.
Setup 3 — Bearish Continuation Below the Weak Low
Direction: Sell
Entry zone: 4,017.000–4,020.000
Required confirmation: A decisive 15-minute close below 4,019.000, followed by a failed reclaim of the Weak Low and bearish lower-timeframe displacement.
Stop Loss: 4,024.500
TP1: 4,011.000
TP2: 4,005.000
TP3: 3,999.500
Acceptance below the Weak Low would expose the major lower demand zone and confirm continuation of the prevailing bearish structure.
Refinement Tip
Use the 15-minute chart as the structural framework and refine execution on the 1-minute or 5-minute timeframe. Do not enter solely because price reaches a zone; require a liquidity event, LTF CHoCH, and decisive momentum confirmation before execution.
⚠️ Disclaimer
Trading financial markets involves significant risk, including the potential loss of capital. No market setup or liquidity model provides guaranteed outcomes, and technical levels can fail because of volatility, slippage, or news-driven repricing. This is a static-chart analysis provided strictly for educational and analytical purposes—not personalized financial advice or a solicitation to trade. Levels are derived from the visible chart scale and may vary slightly between data feeds.