
NVDA Price Action | MSS, BOS & Trendline Resistance Retest
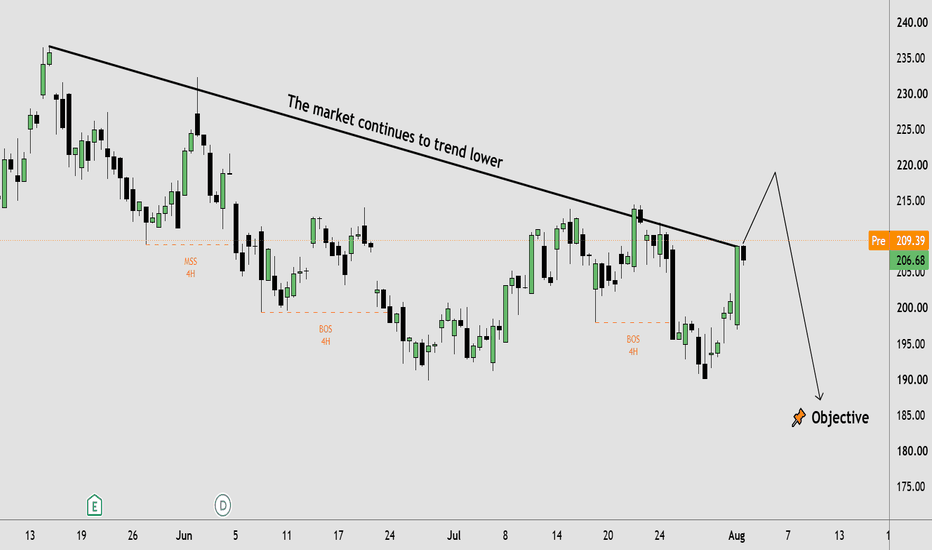
🔹 NVDA continues to trade within a broader bearish market structure, with price respecting a descending trendline that has capped multiple recovery attempts. The recent rally has brought price back into a significant resistance area where previous selling pressure emerged, creating a potential retest of the trendline. Earlier Market Structure Shift (MSS) and Break of Structure (BOS) zones remain visible on the chart, reinforcing the importance of this technical level. Current price action suggests that liquidity may be building around resistance as buyers and sellers test control. From a price action perspective, the overall technical analysis continues to reflect a cautious environment while the broader structure remains tilted to the downside.
🔸 If NVDA shows confirmed rejection from the highlighted resistance zone, the existing bearish market structure could remain intact and price may continue toward lower support areas identified by previous swing lows. Alternatively, if buyers achieve a sustained breakout above the descending trendline and maintain acceptance beyond resistance, the current structure could begin to weaken and a broader recovery might develop. Rather than anticipating direction, traders may prefer waiting for clear price confirmation before considering any trade, as liquidity sweeps and false breakouts can occur near major technical levels.
This analysis is for educational purposes only and does not constitute financial or investment advice. Always conduct your own research before making trading decisions.
