
Nasdaq-100 Wave Analysis – 3 August 2026
US Nasdaq 100 Spot Index FXPRO:NDAQ100
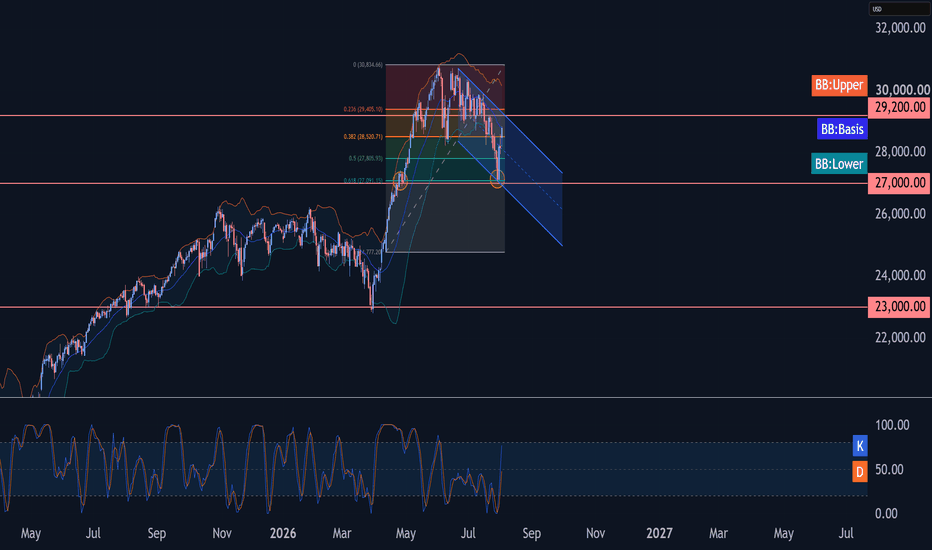
– Nasdaq-100 reversed from support zone
– Likely to rise to resistance level 29200.00
Nasdaq-100 index recently reversed from the support zone between the key support level 27000.00 (which also reversed the price in April), lower daily Bollinger Band and the 61.8% Fibonacci correction of the upward impulse (1) from April.
The upward reversal from this support zone created the daily Japanese candlesticks reversal pattern Bullish Engulfing – which started active impulse wave (3).
Given the clear daily uptrend, Nasdaq-100 index can be expected to rise further to the next resistance level 29200.00.
