
NASDAQ 100 has bottomed out and is on the way to the moon
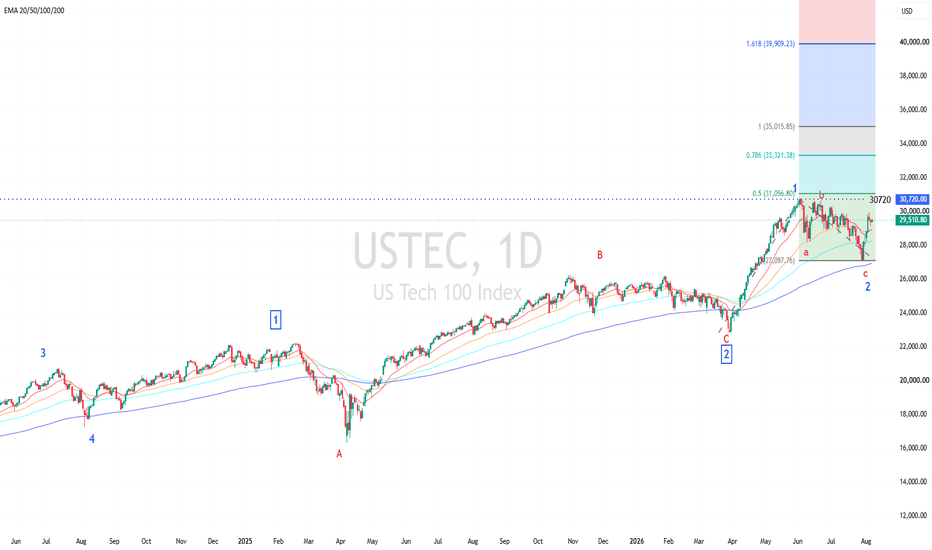
NASDAQ 100 Has Completed Its Correction and Is Ready to Surge to the Moon
Fundamental Analysis
1. The NASDAQ 100 has rebounded strongly, primarily supported by AI-related earnings and investment. The combined earnings per share of NASDAQ 100 companies grew by 45% YoY during the latest earnings season, while the index surged 27.5% in 2Q, although the gains were concentrated in the semiconductor sector.
2. AI investment could reach 700–725 billion USD in 2026, covering chips, data centres, Cloud systems, networking, memory, and energy. Spending by Microsoft, Amazon, Meta, and Alphabet becomes revenue for Nvidia, AMD, Broadcom, Micron, and other infrastructure companies within the NASDAQ 100. Nvidia’s latest overall and Data Center revenues surged by 85% and 92% YoY, respectively, confirming that AI demand is generating real revenue rather than merely market hype. (Nasdaq)
3. Another interesting development is the US support for Japan’s yen intervention by allowing Japan to borrow dollars from the Fed. This arrangement could function as a form of QE. Instead of Japan selling US Treasuries to purchase yen and support its currency, it can borrow dollars directly and use them to buy yen. This effectively reduces the supply of US Treasuries in the market, while the Fed remains the source of funding. These funds may eventually circulate back into US equities through investment, providing further support for the index.
4. The main risks are a more hawkish Fed, which could pressure the index, and the possibility that AI investment may fail to deliver the expected returns.
Technical Analysis
5. USTEC rallied strongly after declining for more than 2 months. During the correction, the index completed a simple a-b-c corrective wave pattern.
6. Wave c ended above EMA200, indicating that the broader uptrend remains intact. This view was reinforced by the index’s rally strongly above the EMA stack, which continues to signal an uptrend across all timeframes.
7. After bottoming in wave c and completing the corrective phase, USTEC rebounded with strong momentum. This suggests the beginning of a powerful upward move consistent with a larger wave 3, which is an impulse wave.
8. If the index breaks above its all-time high at approximately 30,720, the next target may be the 100% Fibonacci Extension at around 35,016.
9. If a pullback occurs, 28,800 may be a key support before the index resumes its uptrend.
Analysis by: Krisada Yoonaisil, Financial Markets Strategist at Exness
