
MRVL Soared 350%+ in Months, Then Fell. What Its Chart Says Here
Semiconductor-chip designer Marvell Technology
 MRVL
has been remarkably volatile this year, rising 350%+ in just four months to hit a June 18 all-time high, then pulling back some 35% since then. Let's see what its chart and fundamentals can tell us about what might happen next.
MRVL
has been remarkably volatile this year, rising 350%+ in just four months to hit a June 18 all-time high, then pulling back some 35% since then. Let's see what its chart and fundamentals can tell us about what might happen next.
Marvell's Fundamental Analysis
The whole semiconductor group has been hot and cold over recent months, but it seems like MRVL has been among either the leaders or the losers within the Dow Jones U.S. Semiconductors Index
DJUSSC
on almost a daily basis.
After a nasty sell-off that lasted into late July, MRVL reacted well this week to the firm unveiling new products to support AI memory infrastructure.
The new offerings expanded Marvell's portfolio for AI storage, rack-scale memory expansion and optical shared memory.
For instance, the firm introduced a new Bravera SC6 PCIe 6.0 SSD controller that doubled the performance of Marvell's previous controller and improves AI-inference efficiency by accelerating KV cache workloads.
MRVL also announced new Photonic Fabric memory modules and chiplets aimed at enabling multi-rack optical-shared-memory architectures for next-generation AI infrastructure.
These new products came out at a time when Marvell is preparing to release fiscal Q2 results in late August.
Wall Street is expecting the firm to report $0.40 in GAAP earnings per share and $0.93 in adjusted EPS on roughly $2.7 billion of revenue. Results like that would be good for almost 35% in annual sales growth, as well as an 81.8% gain from the $0.40 in GAAP that Marvell posted for the same quarter last year.
Meanwhile, analysts' consensus estimate for adjusted EPS would represent a 38.8% y/y expansion from fiscal Q2 2026's $0.67.
All in, 25 of the 32 sell-side analysts that I know of who cover MRVL have revised their current-quarter earnings estimates higher since the period began, while just three have reduced their numbers. (Five have left their estimates unchanged.)
Marvell's Technical Analysis
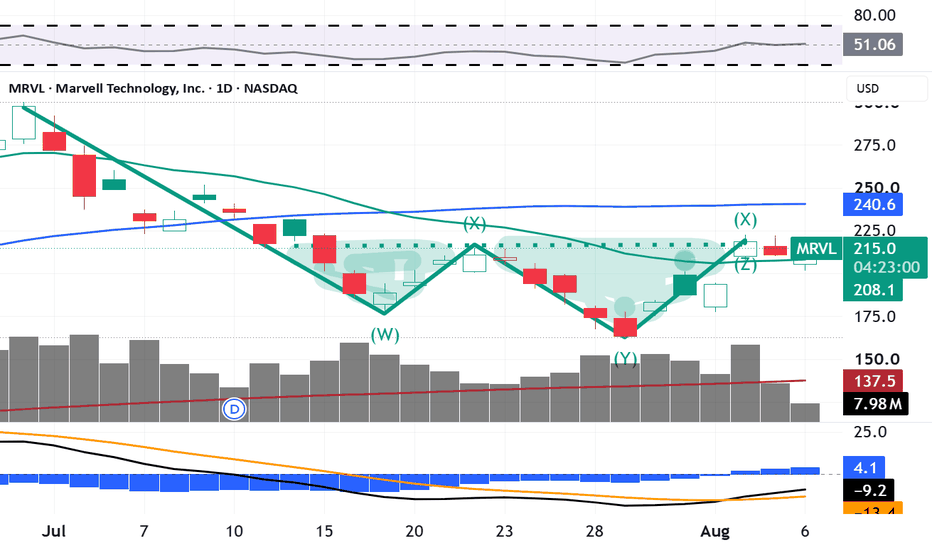
Now let's go to Marvell's chart going back to April and running through Thursday morning (Aug. 6):

After completing that set-up, the stock went on to develop a double-bottom pattern of bullish reversal. That's where we are now some three weeks ahead of earnings.
This pattern's upside pivot stands at $215 (the apex of "W" shape's center). Marvell might be in the process of taking and perhaps holding that level, with the stock trading above $215 for part of this week before closing Wednesday at $211.02.
Should Marvell hold the pivot, shares would face their next test at the stock's 50-day Simple Moving Average (or "SMA," marked with a blue line at $240).
Moving on to the other technical indicators shown above, Marvell's Relative Strength Index (the gray line marked "RSI" at the chart's top) has been improving and has reached above the neutral line.
Marvell's daily Moving Average Convergence Divergence indicator (or "MACD," denoted by blue bars, a black line and a gold line at the chart's bottom), has started to look better as well.
The histogram of the 9-day Exponential Moving Average (or "EMA," marked with blue bars) recently reached above the zero-bound for the first time in more than six weeks. That's bullish.
In addition, the 12-day EMA (the black line) has now overtaken the 26-day EMA (the gold line) -- a bullish signal as well.
However, this signal can be somewhat muted when both lines remain below zero, as they do above. The pattern's bullishness would become considerably stronger if the black line holds above the gold line and both of them move together into positive territory.
(Moomoo Technologies Inc. Markets Commentator Stephen "Sarge" Guilfoyle had no position in MRVL at the time of writing this column.)
This article discusses technical analysis, other approaches, including fundamental analysis, may offer very different views. The examples provided are for illustrative purposes only and are not intended to be reflective of the results you can expect to achieve. Specific security charts used are for illustrative purposes only and are not a recommendation, offer to sell, or a solicitation of an offer to buy any security. Past investment performance does not indicate or guarantee future success. Returns will vary, and all investments carry risks, including loss of principal. This content is also not a research report and is not intended to serve as the basis for any investment decision. The information contained in this article does not purport to be a complete description of the securities, markets, or developments referred to in this material. Moomoo and its affiliates make no representation or warranty as to the article's adequacy, completeness, accuracy or timeliness for any particular purpose of the above content. Furthermore, there is no guarantee that any statements, estimates, price targets, opinions or forecasts provided herein will prove to be correct.
Moomoo is a financial information and trading app offered by Moomoo Technologies Inc. In the U.S., investment products and services on Moomoo are offered by Moomoo Financial Inc., Member FINRA/SIPC.
TradingView is an independent third party not affiliated with Moomoo Financial Inc., Moomoo Technologies Inc., or its affiliates. Moomoo Financial Inc. and its affiliates do not endorse, represent or warrant the completeness and accuracy of the data and information available on the TradingView platform and are not responsible for any services provided by the third-party platform.
