
Institutional Trading Academy Trendline Strategy PriceAction smc
Gold OANDA:XAUUSD
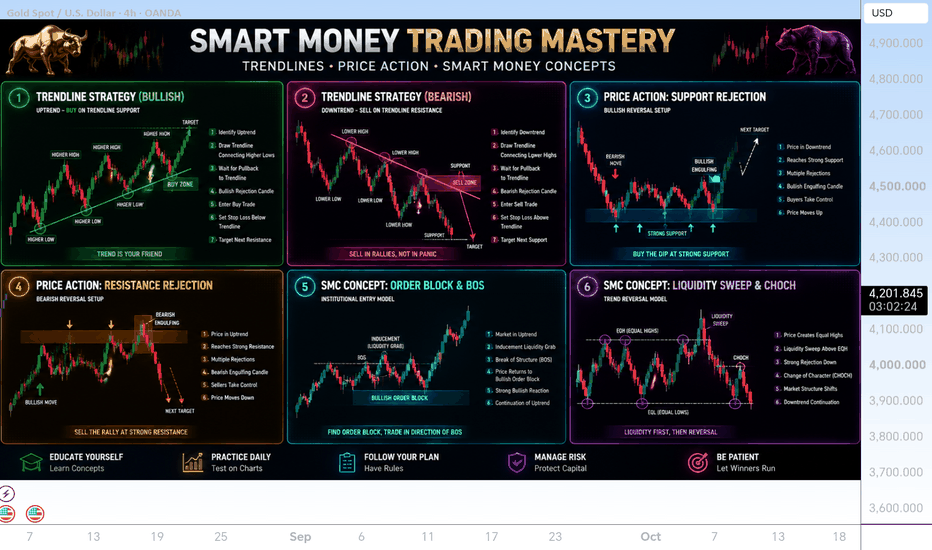
Smart Money Trading Mastery | Complete Trendline, Price Action & SMC Education Guide

A professional trader does not only look at whether a candle is green or red. The real meaning comes from where the candle forms, why it forms, what liquidity it takes, and how the next candles confirm the move.
---
1. Bullish Trendline Strategy — Understanding Buyer Control
A bullish trend develops when buyers consistently protect important support areas.
The first candles create the initial upward movement, showing that buyers are entering the market with strength. As price continues higher, candles start forming Higher Highs (HH) and Higher Lows (HL).
Candle Explanation:
Higher High Candles: These candles show aggressive buying pressure. Buyers are strong enough to push price above previous resistance levels. This indicates that demand is increasing and market sentiment remains positive.
Higher Low Candles: These candles represent buyer protection. When price pulls back, buyers step in before price reaches previous lows. This shows that institutions and experienced traders are defending the trend.
Trendline Touch Candles: When price returns to the bullish trendline, candles often become smaller because buyers and sellers are fighting for control. A rejection from this area indicates that buyers are absorbing selling pressure.
Bullish Rejection Candle: A long lower wick shows that sellers attempted to push price down but failed. Buyers absorbed those orders and closed the candle higher.
Confirmation Candle: A strong bullish candle after rejection confirms that buyers have regained control.
Reason: The reason behind this movement is that traders are finding value at support and entering positions where risk is controlled.
---
2. Bearish Trendline Strategy — Understanding Seller Control
A bearish trend develops when sellers consistently reject higher prices.
The market creates Lower Highs (LH) and Lower Lows (LL), showing that supply is stronger than demand.
Candle Explanation:
Lower High Candles: These candles show that buyers cannot create new highs. Every attempt upward faces selling pressure.
Lower Low Candles: These candles confirm seller dominance because price continues breaking previous support areas.
Resistance Trendline Reaction: When candles reach bearish trendline resistance, sellers enter because price becomes expensive compared to previous levels.
Bearish Rejection Candle: A candle with a long upper wick shows buyers attempted to push higher but sellers rejected the move.
Strong Bearish Candle: This candle confirms aggressive selling and often begins the next downward movement.
Reason: The market moves lower because institutions distribute positions at premium prices before pushing price down.
---
3. Price Action — Support Rejection Analysis
Candle Explanation:
Strong Selling Candles: Initial bearish candles show sellers controlling momentum and pushing price toward support.
Small Body Candles Near Support: These candles show uncertainty. Sellers are losing power while buyers are preparing to enter.
Long Wick Rejection Candles: The lower wick proves that sellers attempted to break support but failed.
Bullish Engulfing Candle: This candle completely covers the previous bearish candle, showing strong buyer takeover.
Continuation Candles: Following bullish candles confirm that buyers have successfully shifted momentum.
Reason: Support works because demand increases when price reaches a valuable area.
---
4. Price Action — Resistance Rejection Analysis
Resistance represents an area where selling pressure appears.
Candle Explanation:
Bullish Movement Candles: Price moves upward as buyers attempt to continue the trend.
Resistance Touch Candles: Momentum slows because buyers are reaching an area where sellers previously entered.
Upper Wick Rejection Candles: Long upper wicks indicate sellers are rejecting higher prices.
Bearish Engulfing Candle: Shows sellers completely overpower buyers.
Continuation Bearish Candles: Confirm that price is moving away from resistance.
Reason: Sellers enter because price reaches an area considered expensive.
---
5. Smart Money Concept — Order Block & Break of Structure
Candle Explanation:
Accumulation Candles: Small candles before a strong move show institutions quietly building positions.
Liquidity Grab Candle: Price moves against traders to collect stop orders before the real direction begins.
Expansion Candles: Large candles show institutional involvement and strong momentum.
BOS Candle (Break of Structure): A candle breaking a previous high or low confirms that market structure has changed.
Retest Candles: Price returns to the Order Block, allowing traders to observe whether institutions defend the zone.
Reaction Candles: Strong movement away from the zone confirms institutional interest.
Reason: Smart money requires liquidity to enter large positions, which is why these zones become important.
---
6. Smart Money Concept — Liquidity Sweep & CHoCH
Liquidity is where traders place their stop losses and pending orders.
Candle Explanation:
Equal Highs (EQH): Multiple candles reaching the same high create liquidity above the market.
Equal Lows (EQL): Multiple candles reaching the same low create liquidity below the market.
Liquidity Sweep Candle: Price briefly breaks the level, collects orders, and traps traders before reversing.
Rejection Candle: Shows that the breakout was not genuine and market direction may change.
CHoCH Candle: The first candle that breaks previous structure, indicating a possible trend reversal.
New Structure Candles: Confirm the new direction after the market shift.
Reason: Institutions often move price toward liquidity before starting the actual expansion.
---
Complete Professional Candle Reading Summary
Every candle answers important questions:
Who is controlling the market?
Buyers or sellers?
Where is liquidity located?
Above highs or below lows?
Why did price react from that zone?
Support, resistance, order block, or liquidity?
Is the trend continuing or changing?
BOS and CHoCH provide confirmation.
Where is the smart money entering?
At valuable institutional zones.
---
This complete education chart teaches traders how to understand the story behind every candle using:
Trendline Analysis
Market Psychology
Price Action
Support & Resistance
Order Blocks
Liquidity Concepts
BOS & CHoCH
Institutional Trading Logic
Risk Management
A candle is not just a candle — it is the footprint of market decisions. Learn the reason behind every move and build a professional trading mindset.
