EUR/USD Triangle Breakdown: Bears Target Lower Liquidity Zones
EUR/USD Technical Analysis – Bearish Outlook
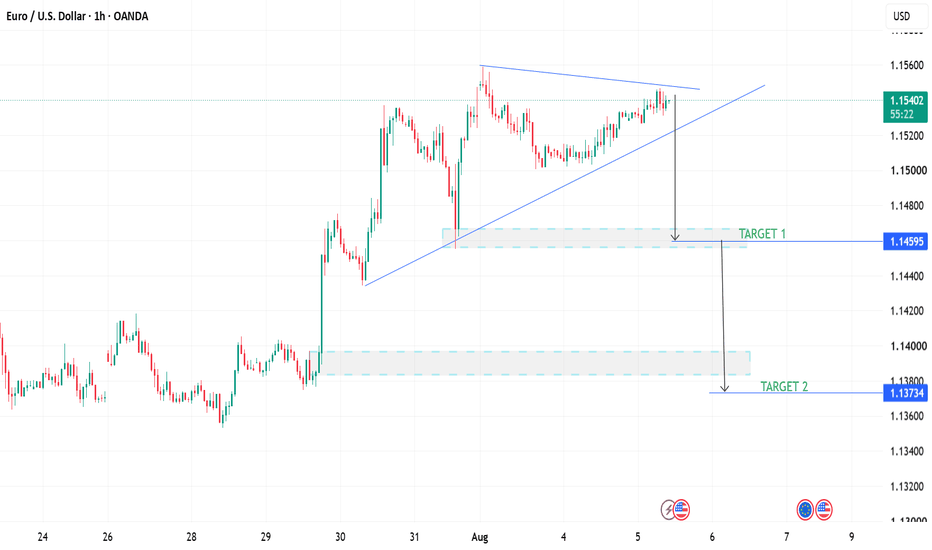
EUR/USD is trading within a *symmetrical triangle*, with price compressing between rising support and descending resistance. The recent recovery has lost momentum beneath a key supply zone, suggesting buyers are struggling to sustain the uptrend. As volatility contracts, the market appears to be preparing for a decisive breakout, with the current structure favoring a bearish resolution.
From a technical perspective, the 1.15474–1.15595 resistance zone remains the primary barrier for buyers. Multiple rejections from this region indicate that sellers continue to defend higher prices. Unless bulls reclaim this resistance with a strong breakout, the recent advance is likely to remain corrective within the broader bearish structure.
On the downside, a confirmed **break of structure (BOS)** below the ascending trendline would signal that sellers have regained control, exposing the **1.14595** demand zone as the first downside objective. If selling pressure accelerates and liquidity below this support is swept, EUR/USD could extend its decline toward the **1.13734** liquidity zone, which remains the primary bearish target.
Key Technical Levels
Resistance
1.15474 – Initial resistance
1.15595 – Major supply zone
Support
Ascending trendline** – Dynamic support
1.14595 – First bearish target
1.13734 – Primary liquidity target
Bearish Thesis
* EUR/USD remains compressed within a symmetrical triangle, signaling an impending volatility expansion.
* The **1.15474–1.15595** resistance zone continues to cap bullish momentum.
* A confirmed **break of structure (BOS)** below the ascending trendline would validate the bearish continuation scenario.
* A break below **1.14595** could trigger sell-side liquidity and accelerate the decline toward **1.13734**.
### **Professional Insights**
* **Market Structure:** Price continues to print lower highs beneath descending resistance, indicating weakening bullish momentum.
* **Liquidity:** Sell-side liquidity is concentrated below **1.14595**, making it the most likely magnet if support fails.
* **Order Flow:** Buyers are defending the ascending trendline, but repeated failures to break resistance suggest sellers remain in control.
* **Breakout Setup:** Triangle compression reflects declining volatility, often preceding an impulsive directional move.
* **Confirmation:** A confirmed break below trendline support would provide higher-probability confirmation of bearish continuation.
### **Trade Invalidation**
The bearish outlook will be invalidated by a **decisive break and sustained close above 1.16200**. Such a move would invalidate the current bearish structure, confirm a bullish breakout, and increase the probability of further upside.