

EUR/USD 2H — BULLISH BREAKOUT & RETEST
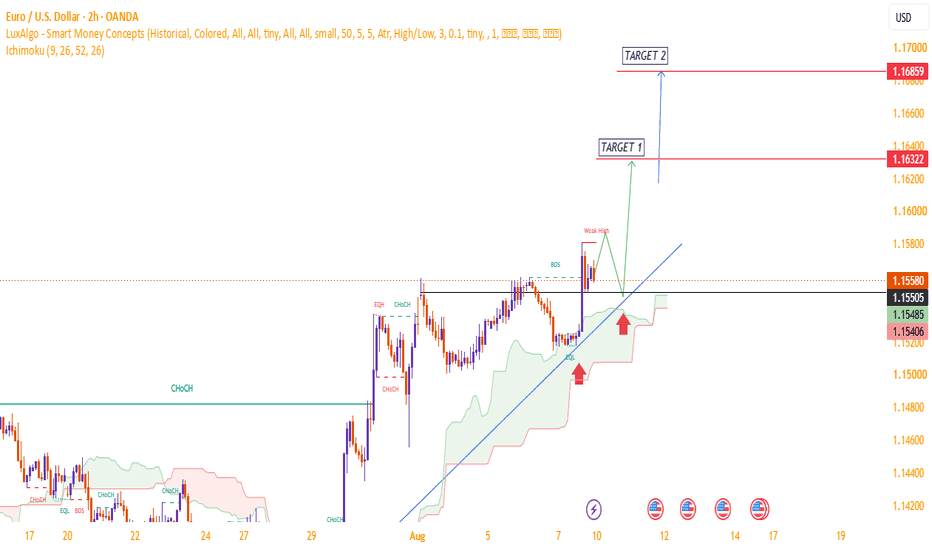
Market Structure
EUR/USD has shifted into a bullish structure on the 2H chart.
✅ Bullish BOS confirmed
✅ Price holding above the 1.1550 structure level
✅ Rising trendline supporting higher lows
✅ Ichimoku cloud is acting as dynamic support
⚠️ A recent weak high around 1.1580 remains the first liquidity target
The current structure favors buying the pullback rather than chasing the breakout.
🎯 Bullish Trade Plan
Entry Zone: 1.1540 – 1.1555
Stop Loss: 1.1515
TP1: 1.1632
TP2: 1.1686
Approximate R:R from a 1.1550 entry:
TP1 → 1:3.3
TP2 → 1:5.4
⚡ Entry Confirmation
Watch for price to pull back into the 1.1540–1.1555 support/confluence zone.
Best confirmation would be:
Liquidity sweep → bullish rejection → lower-timeframe BOS → continuation
If price breaks and closes strongly below the rising trendline/cloud support, the bullish setup loses strength.
🧲 Liquidity Map
Upside liquidity:
1.1580 — recent weak high
1.1632 — TP1
1.1686 — TP2 / major upside objective
Support:
1.1550
1.1540
1.1515 — bullish invalidation area
🐂 Bullish Scenario
A successful retest of 1.1540–1.1555, followed by bullish confirmation, could send EUR/USD toward 1.1632 first and potentially 1.1686.
🐻 Bearish Scenario
A decisive 2H close below the 1.1515 area would weaken the bullish structure and signal that the breakout may have failed.
📌 Final Bias
BULLISH 🟢
The key is not chasing the breakout — wait for the pullback and confirmation.
